Ninety-Third Street Elementary School
Rating
Not Available
Not Available

5 out of 5 | 1 Review
Find Old Friends From Ninety-Third Street Elementary School
Use the form below to search for alumni from Ninety-Third Street Elementary School.
School Description
School Summary and Highlights
- Enrolls 1,094 elementary school students from grades KG-5
- Ranks 4559th out of 5,423 elementary schools in CA.
- 2010 Overall School AYP Met Status: No
Additional Contact Information
- Mailing Address: 330 East 93rd St., Los Angeles, CA 90003
School Operational Details
- Title I EligibleAll students of this school are eligible for participation in authorized programs.
School District Details
- Los Angeles Unified School District
- Per-Pupil Spending: $11,357
- Graduation Rate: 48.8%
- Dropout Rate: 6.8%
- Students Per Teacher: 21.3
- Enrolled Students: 667,870
Faculty Details and Student Enrollment
Students and Faculty
- Total Students Enrolled: 1,094
- Total Full Time "Equivalent" Teachers: 52.0
- Average Student-To-Teacher Ratio: 21.0
Students Gender Breakdown
- Males: 574 (52.5%)
- Females: 520 (47.5%)
Free Lunch Student Eligibility Breakdown
- Eligible for Reduced Lunch: 8 (0.7%)
- Eligible for Free Lunch: 1,020 (93.2%)
- Eligible for Either Reduced or Free Lunch: 1,028 (94.0%)
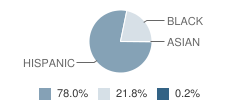
Student Enrollment Distribution by Race / Ethnicity
| Number | Percent | |
|---|---|---|
| American Indian | - | - |
| Black | 238 | 21.8% |
| Asian | 2 | 0.2% |
| Hispanic | 853 | 78.0% |
| White | - | - |
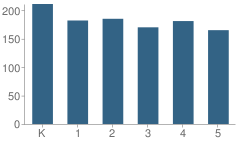
Number of Students Per Grade
| Number | Percent | |
|---|---|---|
| Kindergarten | 211 | 19.3% |
| 1st Grade | 182 | 16.6% |
| 2nd Grade | 185 | 16.9% |
| 3rd Grade | 170 | 15.5% |
| 4th Grade | 181 | 16.5% |
| 5th Grade | 165 | 15.1% |
Teacher Education Background (2009)
Percent With Master's Degree
School:
10.6%
District:
26.9%
Percent With Bachelor's Degree
School:
9.1%
District:
31.9%
Teacher Credentials & Experience (2009)
Percent of Teachers With Credentials: 100.0%
Number of Certificated Staff: 66.0
Average Number of Years of Teacher Experience: 11.0
Average Age
School:
39.2
District:
46.7
Source: CA Department of Education, Source: NCES 2009-2010
School Ratings and Reviews
Overall Rating: 5

5 out of 5 | 1 Review
The Overall Rating is the school's average rating from parents, students, school faculty and staff. The highest rating is five apples and the lowest is one apple.
Share Your Review About This School
1 review for Ninety-Third Street Elementary School
- Reviewed by Parent/Guardian on September 20, 2009
- Rating:
 (5 / 5) Flag as inappropriate
 - that school is great
School Map and Similar Schools Nearby
Click to Activate Map of Nearby School Campuses
Private
Public
This School
Similar Schools Nearby
| South Park Elementary School KG-5 | 946 Students | 0.6 miles away |  5 out of 5 | |
| Ninety-Ninth Street Elementary School KG-5 | 494 Students | 0.7 miles away | 5 out of 5 | |
| Charles W. Barrett Elementary School KG-5 | 1,105 Students | 0.8 miles away | Not Yet Rated | |
| One Hundred Seventh Street Elementary School KG-5 | 952 Students | 0.9 miles away | Not Yet Rated | |
| Russell Elementary School KG-5 | 1,093 Students | 1.1 miles away | Not Yet Rated | |
| Manchester Avenue Elementary School KG-5 | 943 Students | 1.1 miles away |  4.5 out of 5 | |
| One Hundred Ninth Street Elementary School KG-5 | 495 Students | 1.1 miles away | 5 out of 5 | |
| Ninety-Sixth Street Elementary School KG-5 | 878 Students | 1.2 miles away | 5 out of 5 | |
| Mckinley Avenue Elementary School KG-5 | 881 Students | 1.2 miles away | 5 out of 5 | |
| Danny J. Bakewell, Senior Primary Center School KG | 254 Students | 1.3 miles away | Not Yet Rated | - |
Compare This School To Nearby Schools ->
School Community Forum

Join a discussion about Ninety-Third Street Elementary School and talk to others in the community including students, parents, teachers, and administrators.
Popular Discussion Topics
- Admissions and Registration Questions (e.g. Dress Code and Discipline Policy)
- School Calendar and Upcoming Events (e.g. Graduation)
- After School Programs, Extracurricular Activities, and Athletics (e.g. Football)
- News and Announcements (e.g. Yearbook and Class Supply List Details)
- Graduate and Alumni Events (e.g. Organizing Class Reunions)
Navigation
Can't Find What You Are Looking For?
Rankings
Nearby Cities
Sponsored Links
K-12 Articles

Preparing Your Child for the First Day of School
It seems like school was just dismissed for the summer, yet here we are facing another year of back...
It seems like school was just dismissed for the summer, yet here we are facing another year of back...

The First Day of School
The first day of kindergarten is a rite of passage for any student. Every mother cries and...
The first day of kindergarten is a rite of passage for any student. Every mother cries and...

A Cheat Sheet on Cheating
Senior projects are coming due and finals are coming up. Spring has sprung, and with spring comes...
Senior projects are coming due and finals are coming up. Spring has sprung, and with spring comes...