South Gate Middle School
Rating
Not Available
Not Available

4 out of 5 | 3 Reviews
Find Old Friends From South Gate Middle School
Use the form below to search for alumni from South Gate Middle School.
School Description
School Summary and Highlights
- Enrolls 2,780 middle school students from grades 6-8
- Ranks 1669th out of 2,050 middle schools in CA.
- 2010 Overall School AYP Met Status: No
Additional Contact Information
- Mailing Address: 4100 Firestone Blvd., South Gate, CA 90280
School Operational Details
- Title I EligibleAll students of this school are eligible for participation in authorized programs.
School District Details
- Los Angeles Unified School District
- Per-Pupil Spending: $11,357
- Graduation Rate: 48.8%
- Dropout Rate: 6.8%
- Students Per Teacher: 21.3
- Enrolled Students: 667,870
Faculty Details and Student Enrollment
Students and Faculty
- Total Students Enrolled: 2,780
- Total Full Time "Equivalent" Teachers: 114.6
- Average Student-To-Teacher Ratio: 24.3
Students Gender Breakdown
- Males: 1,427 (51.3%)
- Females: 1,353 (48.7%)
Free Lunch Student Eligibility Breakdown
- Eligible for Reduced Lunch: 234 (8.4%)
- Eligible for Free Lunch: 2,208 (79.4%)
- Eligible for Either Reduced or Free Lunch: 2,442 (87.8%)
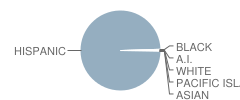
Student Enrollment Distribution by Race / Ethnicity
| Number | Percent | |
|---|---|---|
| American Indian | 5 | 0.2% |
| Black | 6 | 0.2% |
| Asian | 1 | 0.04% |
| Hispanic | 2,756 | 99.1% |
| White | 8 | 0.3% |
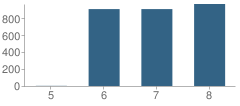
Number of Students Per Grade
| Number | Percent | |
|---|---|---|
| 5th Grade | 2 | 0.07% |
| 6th Grade | 906 | 32.6% |
| 7th Grade | 906 | 32.6% |
| 8th Grade | 966 | 34.7% |
Teacher Education Background (2009)
Percent With Ph.D.
School:
1.4%
District:
3.7%
Percent With Master's Degree
School:
8.6%
District:
26.9%
Percent With Bachelor's Degree
School:
18.6%
District:
31.9%
Teacher Credentials & Experience (2009)
Percent of Teachers With Credentials: 98.3%
Number of Certificated Staff: 140.0
Average Number of Years of Teacher Experience: 10.0
Average Age
School:
39.4
District:
46.7
Source: CA Department of Education, Source: NCES 2009-2010
School Ratings and Reviews
Overall Rating: 4

4 out of 5 | 3 Reviews
The Overall Rating is the school's average rating from parents, students, school faculty and staff. The highest rating is five apples and the lowest is one apple.
Share Your Review About This School
3 reviews for South Gate Middle School
- Reviewed by Former Student on September 15, 2011
- Rating:
 (2 / 5) Flag as inappropriate
 - This school was good, but I feel the adults there need to make sure to notice the needs of their students. All in all an ok school.
- Reviewed by Parent/Guardian on June 17, 2009
- Rating:
 (5 / 5) Flag as inappropriate
 - south gate middle
- Reviewed by Parent/Guardian on February 03, 2009
- Rating: (5 / 5) Flag as inappropriate
- FANTASTiC SChOOl!
School Map and Similar Schools Nearby
Click to Activate Map of Nearby School Campuses
Private
Public
This School
Similar Schools Nearby
| Teresa Hughes Elementary School KG-6 | 1,028 Students | 0.9 miles away |  4 out of 5 | |
| Elizabeth Learning Center School KG-12 | 2,117 Students | 1.1 miles away | Not Yet Rated | |
| Park Avenue Elementary School KG-6 | 576 Students | 1.5 miles away | Not Yet Rated | |
| Ellen Ochoa Learning Center School KG-8 | 1,649 Students | 1.5 miles away | Not Yet Rated | |
| Southeast Middle School 6-8 | 1,356 Students | 1.7 miles away | Not Yet Rated | |
| International Studies Learning Community School 6-12 | 782 Students | 1.7 miles away | Not Yet Rated | |
| Bell Gardens Intermediate School 5-8 | 1,512 Students | 2.2 miles away | Not Yet Rated | |
| Henry T. Gage Middle School 6-8 | 2,578 Students | 2.2 miles away | Not Yet Rated | |
| Chester W. Nimitz Middle School 6-8 | 2,783 Students | 2.3 miles away | Not Yet Rated | |
| Middleton Street Elementary School KG-6 | 1,447 Students | 2.5 miles away |  1 out of 5 | |
Compare This School To Nearby Schools ->
School Community Forum

Join a discussion about South Gate Middle School and talk to others in the community including students, parents, teachers, and administrators.
Popular Discussion Topics
- Admissions and Registration Questions (e.g. Dress Code and Discipline Policy)
- School Calendar and Upcoming Events (e.g. Graduation)
- After School Programs, Extracurricular Activities, and Athletics (e.g. Football)
- News and Announcements (e.g. Yearbook and Class Supply List Details)
- Graduate and Alumni Events (e.g. Organizing Class Reunions)
Navigation
Can't Find What You Are Looking For?
Rankings
Nearby Cities
Sponsored Links
K-12 Articles

Teaching Children Respect
Statistics prove that there are many different family types in today's society. Grandparents or a...
Statistics prove that there are many different family types in today's society. Grandparents or a...

Information on Cyberbullying
What is Cyberbullying? Cyberbullying is a new form of harassment, emotional abuse,...
What is Cyberbullying? Cyberbullying is a new form of harassment, emotional abuse,...

Democracy in Action
There is still over a year until the general election, but the election cycle has been in full...
There is still over a year until the general election, but the election cycle has been in full...