Vaughn Next Century Learning Center School
Rating
Not Available
Not Available

4.5 out of 5 | 2 Reviews
Find Old Friends From Vaughn Next Century Learning Center School
Use the form below to search for alumni from Vaughn Next Century Learning Center School.
School Description
School Summary and Highlights
- Enrolls 2,137 elementary, middle, and high school students from grades KG-12
- Ranks 777th out of 1,197 high schools in CA.
- 2010 Overall School AYP Met Status: No
Additional Contact Information
- Mailing Address: 13330 Vaughn St., San Fernando, CA 91340
School Operational Details
- Title I Eligible
- Charter School
School District Details
- Los Angeles Unified School District
- Per-Pupil Spending: $11,357
- Graduation Rate: 48.8%
- Dropout Rate: 6.8%
- Students Per Teacher: 21.3
- Enrolled Students: 667,870
Faculty Details and Student Enrollment
Students and Faculty
- Total Students Enrolled: 2,137
- Total Full Time "Equivalent" Teachers: 104.0
- Average Student-To-Teacher Ratio: 20.6
Students Gender Breakdown
- Males: 1,015 (47.5%)
- Females: 1,122 (52.5%)
Free Lunch Student Eligibility Breakdown
- Eligible for Reduced Lunch: 40 (1.9%)
- Eligible for Free Lunch: 2,000 (93.6%)
- Eligible for Either Reduced or Free Lunch: 2,040 (95.5%)
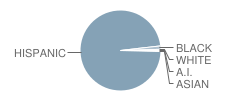
Student Enrollment Distribution by Race / Ethnicity
| Number | Percent | |
|---|---|---|
| American Indian | 1 | 0.05% |
| Black | 29 | 1.4% |
| Asian | 8 | 0.4% |
| Hispanic | 2,088 | 97.7% |
| White | 10 | 0.5% |
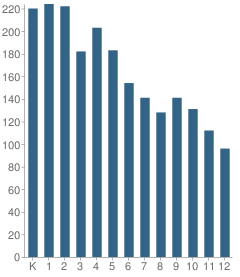
Number of Students Per Grade
| Number | Percent | |
|---|---|---|
| Kindergarten | 220 | 10.3% |
| 1st Grade | 224 | 10.5% |
| 2nd Grade | 222 | 10.4% |
| 3rd Grade | 182 | 8.5% |
| 4th Grade | 203 | 9.5% |
| 5th Grade | 183 | 8.6% |
| 6th Grade | 154 | 7.2% |
| 7th Grade | 141 | 6.6% |
| 8th Grade | 128 | 6.0% |
| 9th Grade | 141 | 6.6% |
| 10th Grade | 131 | 6.1% |
| 11th Grade | 112 | 5.2% |
| 12th Grade | 96 | 4.5% |
Teacher Education Background (2009)
Percent With Bachelor's Degree
School:
4.2%
District:
31.9%
Percent With Master's Degree
School:
15.8%
District:
26.9%
Teacher Credentials & Experience (2009)
Average Age
School:
43.8
District:
46.7
Average Number of Years of Teacher Experience: 6.3
Number of Certificated Staff: 120.0
Percent of Teachers With Credentials: 83.7%
Source: CA Department of Education, Source: NCES 2009-2010
School Ratings and Reviews
Overall Rating: 4.5

4.5 out of 5 | 2 Reviews
The Overall Rating is the school's average rating from parents, students, school faculty and staff. The highest rating is five apples and the lowest is one apple.
Share Your Review About This School
2 reviews for Vaughn Next Century Learning Center School
- Reviewed by Parent or Guardian on May 02, 2011
- Rating:
 (4 / 5) Flag as inappropriate
 - Pros: It's charter; great teachers; It's from Pre-K to 12th grade; Dr. Chan has a great vision for the school; average students per classroom is 20; great after school program;
Cons: Limited gifted program; limited music classes; neighborhood; the usage of the main school yard is shared with the Jr. High.
- Reviewed by Teacher on April 13, 2009
- Rating:
 (5 / 5) Flag as inappropriate
 - best place for work and my child's education!
School Map and Similar Schools Nearby
Click to Activate Map of Nearby School Campuses
Private
Public
This School
Similar Schools Nearby
| Discovery Charter Preparatory #2 School 9-12 | 351 Students | 1.0 miles away | Not Yet Rated | - |
| North Valley Charter Academy 6-12 | 229 Students | 4.1 miles away | Not Yet Rated | |
| Granada Hills Charter High School 9-12 | 4,143 Students | 5.9 miles away | Not Yet Rated | |
| Charter High School of Arts-Multimedia & Performing Arts 9-12 | 487 Students | 6.0 miles away | Not Yet Rated | |
| Community Charter Early College High School 9-12 | 424 Students | 7.1 miles away | Not Yet Rated | |
| Birmingham High School 9-12 | 2,690 Students | 7.8 miles away |  4 out of 5 | |
| High Technology High School 9-12 | 320 Students | 8.0 miles away | Not Yet Rated | |
| Community Harvest Charter School 6-12 | 311 Students | 8.3 miles away |  1 out of 5 | |
| Magnolia Science Academy 6-12 | 478 Students | 8.3 miles away | Not Yet Rated | |
| Magnolia Science Academy 2 6-11 | 227 Students | 8.9 miles away | Not Yet Rated | - |
Compare This School To Nearby Schools ->
School Community Forum

Join a discussion about Vaughn Next Century Learning Center School and talk to others in the community including students, parents, teachers, and administrators.
Popular Discussion Topics
- Admissions and Registration Questions (e.g. Dress Code and Discipline Policy)
- School Calendar and Upcoming Events (e.g. Graduation)
- After School Programs, Extracurricular Activities, and Athletics (e.g. Football)
- News and Announcements (e.g. Yearbook and Class Supply List Details)
- Graduate and Alumni Events (e.g. Organizing Class Reunions)
Navigation
Can't Find What You Are Looking For?
Rankings
Nearby Cities
Sponsored Links
K-12 Articles

Making Sense of No Child Left Behind
The No Child Left Behind Act of 2001 has met with mixed results and mixed feelings. Some think it...
The No Child Left Behind Act of 2001 has met with mixed results and mixed feelings. Some think it...

Public or Private?
Daniel attended private school until sixth grade, when he was diagnosed with Asperger’s Syndrome, a...
Daniel attended private school until sixth grade, when he was diagnosed with Asperger’s Syndrome, a...

School Violence: Can It Be Stopped
It’s a fact that violence in schools is prevalent in today’s society. We hear of school shootings,...
It’s a fact that violence in schools is prevalent in today’s society. We hear of school shootings,...