Lenicia B. Weemes Elementary School
Rating
Not Available
Not Available

No Reviews Yet
Find Old Friends From Lenicia B. Weemes Elementary School
Use the form below to search for alumni from Lenicia B. Weemes Elementary School.
School Description
School Summary and Highlights
- Enrolls 1,028 elementary school students from grades KG-5
- Ranks 4268th out of 5,423 elementary schools in CA.
- 2010 Overall School AYP Met Status: No
Additional Contact Information
- Mailing Address: 1260 West 36th Pl., Los Angeles, CA 90007
School Operational Details
- Title I EligibleAll students of this school are eligible for participation in authorized programs.
School District Details
- Los Angeles Unified School District
- Per-Pupil Spending: $11,357
- Graduation Rate: 48.8%
- Dropout Rate: 6.8%
- Students Per Teacher: 21.3
- Enrolled Students: 667,870
Faculty Details and Student Enrollment
Students and Faculty
- Total Students Enrolled: 1,028
- Total Full Time "Equivalent" Teachers: 51.0
- Average Student-To-Teacher Ratio: 20.2
Students Gender Breakdown
- Males: 496 (48.2%)
- Females: 532 (51.8%)
Free Lunch Student Eligibility Breakdown
- Eligible for Reduced Lunch: 15 (1.5%)
- Eligible for Free Lunch: 879 (85.5%)
- Eligible for Either Reduced or Free Lunch: 894 (87.0%)
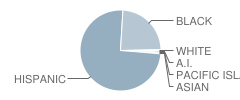
Student Enrollment Distribution by Race / Ethnicity
| Number | Percent | |
|---|---|---|
| American Indian | 7 | 0.7% |
| Black | 243 | 23.6% |
| Asian | 6 | 0.6% |
| Hispanic | 762 | 74.1% |
| White | 4 | 0.4% |
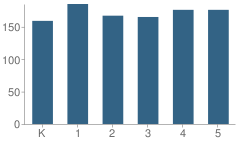
Number of Students Per Grade
| Number | Percent | |
|---|---|---|
| Kindergarten | 159 | 15.5% |
| 1st Grade | 185 | 18.0% |
| 2nd Grade | 167 | 16.2% |
| 3rd Grade | 165 | 16.1% |
| 4th Grade | 176 | 17.1% |
| 5th Grade | 176 | 17.1% |
Teacher Education Background (2009)
Percent With Ph.D.
School:
1.7%
District:
3.7%
Percent With Master's Degree
School:
16.9%
District:
26.9%
Percent With Bachelor's Degree
School:
11.9%
District:
31.9%
Teacher Credentials & Experience (2009)
Percent of Teachers With Credentials: 100.0%
Number of Certificated Staff: 59.0
Average Number of Years of Teacher Experience: 12.4
Average Age
School:
42.5
District:
46.7
Source: CA Department of Education, Source: NCES 2009-2010
School Ratings and Reviews
Be The First To Review Lenicia B. Weemes Elementary School!
School Map and Similar Schools Nearby
Click to Activate Map of Nearby School Campuses
Private
Public
This School
Similar Schools Nearby
| John W. Mack Elementary School KG-5 | 471 Students | 0.4 miles away | Not Yet Rated | |
| Foshay Learning Center School KG-12 | 2,837 Students | 0.6 miles away |  5 out of 5 | |
| Vermont Avenue Elementary School KG-5 | 817 Students | 0.6 miles away | 5 out of 5 | |
| Birdielee V. Bright Elementary School KG-5 | 750 Students | 0.8 miles away | Not Yet Rated | |
| Martin Luther King Jr. Elementary School KG-5 | 637 Students | 1.0 miles away | 5 out of 5 | |
| Menlo Avenue Elementary School KG-5 | 791 Students | 1.0 miles away |  1 out of 5 | |
| Twenty-Fourth Street Elementary School KG-5 | 814 Students | 1.2 miles away | 5 out of 5 | |
| Normandie Avenue Elementary School KG-5 | 944 Students | 1.3 miles away | Not Yet Rated | |
| Norwood Street Elementary School KG-5 | 720 Students | 1.4 miles away |  4 out of 5 | |
| Dr. James Edward Jones Primary Center School KG-2 | 219 Students | 1.5 miles away | Not Yet Rated | - |
Compare This School To Nearby Schools ->
School Community Forum

Join a discussion about Lenicia B. Weemes Elementary School and talk to others in the community including students, parents, teachers, and administrators.
Popular Discussion Topics
- Admissions and Registration Questions (e.g. Dress Code and Discipline Policy)
- School Calendar and Upcoming Events (e.g. Graduation)
- After School Programs, Extracurricular Activities, and Athletics (e.g. Football)
- News and Announcements (e.g. Yearbook and Class Supply List Details)
- Graduate and Alumni Events (e.g. Organizing Class Reunions)
Navigation
Can't Find What You Are Looking For?
Rankings
Nearby Cities
Sponsored Links
K-12 Articles

Summer Safety Tips to Keep Kids Safe
It won’t be long until kids run from the school, shrieking in delight because they’re free for the...
It won’t be long until kids run from the school, shrieking in delight because they’re free for the...

Summer Advice
A few weeks ago, at the weekly after-school program I run through my local church, a group of...
A few weeks ago, at the weekly after-school program I run through my local church, a group of...

When Bad Report Cards Happen to Good Kids
It’s mid-term season once again, and semester (or quarter or trimester) grades will be coming out...
It’s mid-term season once again, and semester (or quarter or trimester) grades will be coming out...