Wilmington Middle School
Rating
Not Available
Not Available

5 out of 5 | 1 Review
Find Old Friends From Wilmington Middle School
Use the form below to search for alumni from Wilmington Middle School.
School Description
School Summary and Highlights
- Enrolls 1,977 middle school students from grades 6-8
- Ranks 1789th out of 2,050 middle schools in CA.
- 2010 Overall School AYP Met Status: No
Additional Contact Information
- Mailing Address: 1700 Gulf Ave., Wilmington, CA 90744
School Operational Details
- Title I EligibleAll students of this school are eligible for participation in authorized programs.
School District Details
- Los Angeles Unified School District
- Per-Pupil Spending: $11,357
- Graduation Rate: 48.8%
- Dropout Rate: 6.8%
- Students Per Teacher: 21.3
- Enrolled Students: 667,870
Faculty Details and Student Enrollment
Students and Faculty
- Total Students Enrolled: 1,977
- Total Full Time "Equivalent" Teachers: 99.5
- Average Student-To-Teacher Ratio: 19.9
Students Gender Breakdown
- Males: 1,005 (50.8%)
- Females: 972 (49.2%)
Free Lunch Student Eligibility Breakdown
- Eligible for Reduced Lunch: 131 (6.6%)
- Eligible for Free Lunch: 1,468 (74.3%)
- Eligible for Either Reduced or Free Lunch: 1,599 (80.9%)
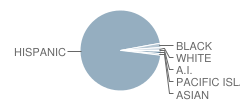
Student Enrollment Distribution by Race / Ethnicity
| Number | Percent | |
|---|---|---|
| American Indian | 8 | 0.4% |
| Black | 35 | 1.8% |
| Asian | 15 | 0.8% |
| Hispanic | 1,870 | 94.6% |
| White | 26 | 1.3% |
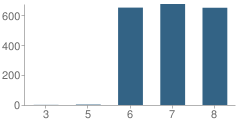
Number of Students Per Grade
| Number | Percent | |
|---|---|---|
| 3rd Grade | 1 | 0.05% |
| 5th Grade | 3 | 0.2% |
| 6th Grade | 650 | 32.9% |
| 7th Grade | 674 | 34.1% |
| 8th Grade | 649 | 32.8% |
Teacher Education Background (2009)
Percent With Ph.D.
School:
1.7%
District:
3.7%
Percent With Master's Degree
School:
13.7%
District:
26.9%
Percent With Bachelor's Degree
School:
18.8%
District:
31.9%
Teacher Credentials & Experience (2009)
Percent of Teachers With Credentials: 96.9%
Number of Certificated Staff: 117.0
Average Number of Years of Teacher Experience: 10.2
Average Age
School:
41.9
District:
46.7
Source: CA Department of Education, Source: NCES 2009-2010
School Ratings and Reviews
Overall Rating: 5

5 out of 5 | 1 Review
The Overall Rating is the school's average rating from parents, students, school faculty and staff. The highest rating is five apples and the lowest is one apple.
Share Your Review About This School
1 review for Wilmington Middle School
- Reviewed by Teacher on August 26, 2010
- Rating:
 (5 / 5) Flag as inappropriate
 - Considering the many variables and all that the administrators, teachers, staff, as well as parents contend with in the neighborhood and the immediate community...It's an operational operational success, and this includes its outstanding parent center. I give it a 5 for effort. However, the problems with children coming from primarily Spanish speaking homes that provide little or no previous frontloading in the 4 disciplines of academics presents a great challenge for the professionals that work there. In addition, without commitment to education from the overall community in lieu of its hardships and lack of foundation in English, the effect bears a great toll on the school's student achievement. Therefore, I consider this school a 5 in comparison to other community schools I have observed in my 25 years as an educatior. Wilmington Middle School is a great place to work as it is a great place to learn if the parent is serious about his/her child's education.
School Map and Similar Schools Nearby
Click to Activate Map of Nearby School Campuses
Private
Public
This School
Similar Schools Nearby
| Caroldale Learning Community School KG-8 | 777 Students | 1.8 miles away | Not Yet Rated | |
| Stephen M. White Middle School 6-8 | 1,849 Students | 2.2 miles away | Not Yet Rated | |
| Alexander Fleming Middle School 6-8 | 1,789 Students | 2.2 miles away | Not Yet Rated | |
| Andrew Carnegie Middle School 6-8 | 1,433 Students | 2.4 miles away | Not Yet Rated | |
| J. H. Hull Middle School 6-8 | 583 Students | 2.8 miles away | Not Yet Rated | |
| Hudson Elementary School KG-8 | 1,136 Students | 3.1 miles away | Not Yet Rated | |
| Rudecinda Sepulveda Dodson Middle School 6-8 | 1,866 Students | 3.3 miles away | Not Yet Rated | |
| Stephens Middle School 6-8 | 1,004 Students | 3.4 miles away | Not Yet Rated | |
| Muir Elementary School KG-8 | 1,060 Students | 3.8 miles away |  5 out of 5 | |
| Crestwood Street Elementary School KG-6 | 496 Students | 3.9 miles away |  3 out of 5 | |
Compare This School To Nearby Schools ->
School Community Forum

Join a discussion about Wilmington Middle School and talk to others in the community including students, parents, teachers, and administrators.
Popular Discussion Topics
- Admissions and Registration Questions (e.g. Dress Code and Discipline Policy)
- School Calendar and Upcoming Events (e.g. Graduation)
- After School Programs, Extracurricular Activities, and Athletics (e.g. Football)
- News and Announcements (e.g. Yearbook and Class Supply List Details)
- Graduate and Alumni Events (e.g. Organizing Class Reunions)
Navigation
Can't Find What You Are Looking For?
Rankings
Nearby Cities
Sponsored Links
K-12 Articles

The Very Best Things in the World
A recent poll in the U.K. revealed that children view the “very best thing in the world” as being...
A recent poll in the U.K. revealed that children view the “very best thing in the world” as being...

Who is Safe?
Between September 26 and October 2, 2006, there were three deadly school shootings and...
Between September 26 and October 2, 2006, there were three deadly school shootings and...

Asperger Syndrome: A Developmental Disorder on the Autism Spectrum
Asperger Syndrome, also known as Pervasive Developmental Disorder is on the high functioning end of...
Asperger Syndrome, also known as Pervasive Developmental Disorder is on the high functioning end of...