Independence Elementary School
Rating
Not Available
Not Available

No Reviews Yet
Find Old Friends From Independence Elementary School
Use the form below to search for alumni from Independence Elementary School.
School Description
School Summary and Highlights
- Enrolls 787 elementary school students from grades KG-5
- Ranks 4226th out of 5,423 elementary schools in CA.
- 2010 Overall School AYP Met Status: No
Additional Contact Information
- Mailing Address: 8435 Victoria Ave., South Gate, CA 90280
School Operational Details
- Title I EligibleAll students of this school are eligible for participation in authorized programs.
School District Details
- Los Angeles Unified School District
- Per-Pupil Spending: $11,357
- Graduation Rate: 48.8%
- Dropout Rate: 6.8%
- Students Per Teacher: 21.3
- Enrolled Students: 667,870
Faculty Details and Student Enrollment
Students and Faculty
- Total Students Enrolled: 787
- Total Full Time "Equivalent" Teachers: 40.0
- Average Student-To-Teacher Ratio: 19.7
Students Gender Breakdown
- Males: 378 (48.0%)
- Females: 409 (52.0%)
Free Lunch Student Eligibility Breakdown
- Eligible for Reduced Lunch: 46 (5.8%)
- Eligible for Free Lunch: 687 (87.3%)
- Eligible for Either Reduced or Free Lunch: 733 (93.1%)
Student Enrollment Distribution by Race / Ethnicity
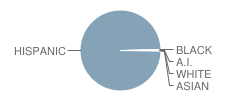
| Number | Percent | |
|---|---|---|
| American Indian | 1 | 0.1% |
| Black | 1 | 0.1% |
| Asian | 1 | 0.1% |
| Hispanic | 780 | 99.1% |
| White | 2 | 0.3% |
Number of Students Per Grade
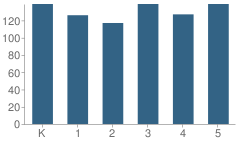
| Number | Percent | |
|---|---|---|
| Kindergarten | 139 | 17.7% |
| 1st Grade | 126 | 16.0% |
| 2nd Grade | 117 | 14.9% |
| 3rd Grade | 139 | 17.7% |
| 4th Grade | 127 | 16.1% |
| 5th Grade | 139 | 17.7% |
Teacher Education Background (2009)
Percent With Master's Degree
School:
8.7%
District:
26.9%
Percent With Bachelor's Degree
School:
6.5%
District:
31.9%
Teacher Credentials & Experience (2009)
Percent of Teachers With Credentials: 100.0%
Number of Certificated Staff: 46.0
Average Number of Years of Teacher Experience: 11.2
Average Age
School:
41.1
District:
46.7
Source: CA Department of Education, Source: NCES 2009-2010
School Ratings and Reviews
Be The First To Review Independence Elementary School!
School Map and Similar Schools Nearby
Click to Activate Map of Nearby School Campuses
Private
Public
This School
Similar Schools Nearby
| State Street Elementary School KG-5 | 951 Students | 0.3 miles away |  4.5 out of 5 | |
| San Gabriel Avenue Elementary School KG-5 | 784 Students | 0.5 miles away |  1 out of 5 | |
| Hope Street Elementary School KG-5 | 623 Students | 0.7 miles away |  5 out of 5 | |
| Liberty Boulevard Elementary School KG-5 | 788 Students | 0.7 miles away | 5 out of 5 | |
| Victoria Avenue Elementary School KG-5 | 773 Students | 0.9 miles away | Not Yet Rated | |
| Stanford Avenue Elementary School KG-5 | 939 Students | 0.9 miles away | 1 out of 5 | |
| Stanford Primary Center School KG | 207 Students | 0.9 miles away | Not Yet Rated | - |
| Madison Elementary School KG-5 | 604 Students | 1.0 miles away | Not Yet Rated | |
| Teresa Hughes Elementary School KG-6 | 1,028 Students | 1.0 miles away |  4 out of 5 | |
| Walnut Park Elementary School KG-5 | 969 Students | 1.0 miles away | 4.5 out of 5 | |
Compare This School To Nearby Schools ->
School Community Forum

Join a discussion about Independence Elementary School and talk to others in the community including students, parents, teachers, and administrators.
Popular Discussion Topics
- Admissions and Registration Questions (e.g. Dress Code and Discipline Policy)
- School Calendar and Upcoming Events (e.g. Graduation)
- After School Programs, Extracurricular Activities, and Athletics (e.g. Football)
- News and Announcements (e.g. Yearbook and Class Supply List Details)
- Graduate and Alumni Events (e.g. Organizing Class Reunions)
Navigation
Can't Find What You Are Looking For?
Rankings
Nearby Cities
Sponsored Links
K-12 Articles

School's out for Recess
Recess used to be the best part of school; that and lunch. But today, a shocking two-thirds of...
Recess used to be the best part of school; that and lunch. But today, a shocking two-thirds of...

Hurt: A Book Report
My last book report was over 15 years ago, and I'm a bit rusty, but here goes (Don't forget: book...
My last book report was over 15 years ago, and I'm a bit rusty, but here goes (Don't forget: book...

Summer Reading
In 1998, a book was published in the US that turned a hatred of reading to love. "Harry Potter and...
In 1998, a book was published in the US that turned a hatred of reading to love. "Harry Potter and...