Belmont High School

4 out of 5 | 1 Review
Find Old Friends From Belmont High School
Use the form below to search for alumni from Belmont High School.
School Description
School Summary and Highlights
- Enrolls 1,340 high school students from grades 9-12
- Ranks 1065th out of 1,197 high schools in CA.
- 2010 Overall School AYP Met Status: No
Additional Contact Information
- Mailing Address: 1575 West 2nd St., Los Angeles, CA 90026
School Operational Details
- Title I EligibleAll students of this school are eligible for participation in authorized programs.
School District Details
- Los Angeles Unified School District
- Per-Pupil Spending: $11,357
- Graduation Rate: 48.8%
- Dropout Rate: 6.8%
- Students Per Teacher: 21.3
- Enrolled Students: 667,870
Faculty Details and Student Enrollment
Students and Faculty
- Total Students Enrolled: 1,340
- Total Full Time "Equivalent" Teachers: 77.8
- Average Student-To-Teacher Ratio: 17.2
Students Gender Breakdown
- Males: 719 (53.7%)
- Females: 621 (46.3%)
Free Lunch Student Eligibility Breakdown
- Eligible for Reduced Lunch: 53 (4.0%)
- Eligible for Free Lunch: 1,095 (81.7%)
- Eligible for Either Reduced or Free Lunch: 1,148 (85.7%)
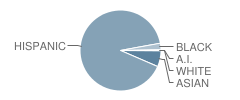
Student Enrollment Distribution by Race / Ethnicity

| Number | Percent | |
|---|---|---|
| American Indian | 2 | 0.1% |
| Black | 34 | 2.5% |
| Asian | 84 | 6.3% |
| Hispanic | 1,199 | 89.5% |
| White | 4 | 0.3% |
Number of Students Per Grade

| Number | Percent | |
|---|---|---|
| 9th Grade | 465 | 34.7% |
| 10th Grade | 385 | 28.7% |
| 11th Grade | 261 | 19.5% |
| 12th Grade | 229 | 17.1% |
Graduates Information (2010)
Graduation Rate
School:
38.5%
District:
69.1%
State:
78.6%
Teacher Education Background (2009)
Percent With Master's Degree
School:
14.2%
District:
26.9%
Percent With Bachelor's Degree
School:
16.0%
District:
31.9%
Teacher Credentials & Experience (2009)
Percent of Teachers With Credentials: 97.6%
Number of Certificated Staff: 106.0
Average Number of Years of Teacher Experience: 12.0
Average Age
School:
44.1
District:
46.7
Source: CA Department of Education, Source: NCES 2009-2010
Sponsored Links
Test Scores and Performance Information
Overall School Rating
How is this determined?
The overall school rating shows that Belmont High School performed on average worse than many other schools across the state on CST state exams in the following subjects:
- CST Algebra I
- CST Algebra II
- CST Biology
- CST Chemistry
- CST English-Language Arts
- CST General Mathematics
- CST Geometry
- CST Integrated/Coordinated Science
- CST Physics
- CST Science
- CST Summative High School Math
- CST U.S. History
- CST World History
AYP Results (2010)
Overall AYP Met: No
ELA AYP Met: No
Math AYP Met: No
Program Improvement (PI) Requirement Under NCLB (2010)
First Year PI Requirement was Implemented: 1997-1998
School's Placement Under NCLB: Year 5
ACT Exam Results (2009)
Percent of Students Taking ACT Exam: 21.0%
Average Combined Score: 16.9
Percent Scoring At or Above 21: 15.6%
SAT Exam Results (2009)
Percent of Students Taking SAT Exam: 91.1%
Average Combined Score: 1,146.4
Critical Reading Average: 378.5
Math Average: 392.5
Writing Average: 375.3
Percent Scoring At or Above 1500: 7.2%
CST - Test Proficiency by Grade and Subject
Grade 9 - % of students at or above proficiency
| School | District | State | |
|---|---|---|---|
| CST Algebra I Test | |||
| 2010 | 9.0% | 11.0% | 22.0% |
| 2009 | 9.0% | 10.0% | 21.0% |
| 2008 | 5.0% | 9.0% | 18.0% |
| CST Biology Test | |||
| 2010 | 22.0% | 27.0% | 55.0% |
| 2009 | 13.0% | 23.0% | 51.0% |
| 2008 | 8.0% | 25.0% | 52.0% |
| CST English-Language Arts Test | |||
| 2010 | 24.0% | 36.0% | 54.0% |
| 2009 | 21.0% | 32.0% | 50.0% |
| 2008 | 15.0% | 31.0% | 49.0% |
| CST Geometry Test | |||
| 2010 | 8.0% | 21.0% | 46.0% |
| 2009 | 23.0% | 23.0% | 47.0% |
| 2008 | 6.0% | 19.0% | 43.0% |
| CST World History Test | |||
| 2010 | 13.0% | 21.0% | 45.0% |
| 2009 | 6.0% | 18.0% | 41.0% |
| 2008 | 3.0% | 15.0% | 36.0% |
| CST General Mathematics Test | |||
| 2008 | 4.0% | 11.0% | 18.0% |
| CST Integrated/Coordinated Science Test | |||
| 2008 | 1.0% | 7.0% | 5.0% |
Grade 10 - % of students at or above proficiency
| School | District | State | |
|---|---|---|---|
| CST Algebra II Test | |||
| 2010 | 17.0% | 21.0% | 40.0% |
| 2009 | 8.0% | 18.0% | 37.0% |
| 2008 | 6.0% | 17.0% | 36.0% |
| CST Biology Test | |||
| 2010 | 19.0% | 29.0% | 38.0% |
| 2009 | 19.0% | 24.0% | 34.0% |
| 2008 | 17.0% | 23.0% | 35.0% |
| CST Chemistry Test | |||
| 2010 | 6.0% | 17.0% | 47.0% |
| 2009 | 3.0% | 15.0% | 44.0% |
| 2008 | 2.0% | 13.0% | 41.0% |
| CST English-Language Arts Test | |||
| 2010 | 25.0% | 33.0% | 45.0% |
| 2009 | 20.0% | 31.0% | 44.0% |
| 2008 | 17.0% | 29.0% | 41.0% |
| CST Geometry Test | |||
| 2010 | 4.0% | 6.0% | 14.0% |
| 2009 | 3.0% | 6.0% | 14.0% |
| 2008 | 1.0% | 5.0% | 12.0% |
| CST Science Test | |||
| 2010 | 32.0% | 32.0% | 46.0% |
| 2009 | 28.0% | 30.0% | 44.0% |
| 2008 | 17.0% | 25.0% | 40.0% |
| CST World History Test | |||
| 2010 | 33.0% | 28.0% | 42.0% |
| 2009 | 25.0% | 24.0% | 38.0% |
| 2008 | 13.0% | 19.0% | 33.0% |
| CST Algebra I Test | |||
| 2009 | 6.0% | 6.0% | 11.0% |
| 2008 | 4.0% | 5.0% | 9.0% |
Grade 11 - % of students at or above proficiency
| School | District | State | |
|---|---|---|---|
| CST Algebra II Test | |||
| 2010 | 12.0% | 6.0% | 14.0% |
| 2009 | 1.0% | 6.0% | 12.0% |
| 2008 | 1.0% | 5.0% | 11.0% |
| CST Chemistry Test | |||
| 2010 | 12.0% | 15.0% | 30.0% |
| 2009 | 7.0% | 13.0% | 27.0% |
| 2008 | 3.0% | 11.0% | 25.0% |
| CST English-Language Arts Test | |||
| 2010 | 28.0% | 34.0% | 42.0% |
| 2009 | 22.0% | 32.0% | 40.0% |
| 2008 | 12.0% | 27.0% | 37.0% |
| CST Physics Test | |||
| 2010 | 14.0% | 26.0% | 53.0% |
| 2009 | - | - | - |
| 2008 | 7.0% | 19.0% | 47.0% |
| CST Summative High School Math Test | |||
| 2010 | 13.0% | 31.0% | 50.0% |
| 2009 | 6.0% | 27.0% | 47.0% |
| 2008 | 15.0% | 25.0% | 43.0% |
| CST U.S. History Test | |||
| 2010 | 37.0% | 33.0% | 45.0% |
| 2009 | 24.0% | 31.0% | 44.0% |
| 2008 | 14.0% | 25.0% | 38.0% |
| CST World History Test | |||
| 2010 | 10.0% | 14.0% | 15.0% |
| 2009 | 12.0% | 8.0% | 11.0% |
| 2008 | 5.0% | 7.0% | 9.0% |
| CST Algebra I Test | |||
| 2009 | 9.0% | 6.0% | 8.0% |
| 2008 | 6.0% | 5.0% | 5.0% |
| CST Biology Test | |||
| 2009 | 20.0% | 26.0% | 41.0% |
| 2008 | 10.0% | 26.0% | 39.0% |
| CST Geometry Test | |||
| 2008 | 2.0% | 2.0% | 6.0% |
End of Course - % of students at or above proficiency
| School | District | State | |
|---|---|---|---|
| CST Algebra I Test | |||
| 2010 | 8.0% | 22.0% | 31.0% |
| 2009 | 9.0% | 19.0% | 28.0% |
| 2008 | 5.0% | 17.0% | 25.0% |
| CST Algebra II Test | |||
| 2010 | 16.0% | 16.0% | 31.0% |
| 2009 | 5.0% | 15.0% | 28.0% |
| 2008 | 4.0% | 13.0% | 27.0% |
| CST Biology Test | |||
| 2010 | 21.0% | 28.0% | 46.0% |
| 2009 | 16.0% | 24.0% | 42.0% |
| 2008 | 14.0% | 24.0% | 42.0% |
| CST Chemistry Test | |||
| 2010 | 8.0% | 16.0% | 38.0% |
| 2009 | 5.0% | 14.0% | 36.0% |
| 2008 | 2.0% | 12.0% | 32.0% |
| CST Geometry Test | |||
| 2010 | 5.0% | 14.0% | 27.0% |
| 2009 | 8.0% | 14.0% | 26.0% |
| 2008 | 2.0% | 11.0% | 24.0% |
| CST Physics Test | |||
| 2010 | 13.0% | 24.0% | 49.0% |
| 2009 | - | - | - |
| 2008 | 9.0% | 18.0% | 43.0% |
| CST Summative High School Math Test | |||
| 2010 | 15.0% | 35.0% | 54.0% |
| 2009 | 6.0% | 30.0% | 50.0% |
| 2008 | 17.0% | 29.0% | 47.0% |
| CST World History Test | |||
| 2010 | 28.0% | 27.0% | 41.0% |
| 2009 | 21.0% | 23.0% | 38.0% |
| 2008 | 11.0% | 18.0% | 33.0% |
| CST General Mathematics Test | |||
| 2008 | 4.0% | 15.0% | 27.0% |
| CST Integrated/Coordinated Science Test | |||
| 2008 | 1.0% | 2.0% | 11.0% |
Source: CA Department of Education 2009-2010
School Map and Similar Schools Nearby
Click to Activate Map of Nearby School Campuses
Private
Public
This School
Similar Schools Nearby
| Los Angeles Teachers Preparatory Academy 9-12 | 229 Students | 0 miles away | Not Yet Rated | - |
| Academic Leadership Community School 9-12 | 445 Students | 0.3 miles away | Not Yet Rated | - |
| School for the Visual Arts and Humanities 9-12 | 398 Students | 0.5 miles away | Not Yet Rated | - |
| Central La Area New High School #9 9-12 | 1,089 Students | 1.0 miles away | Not Yet Rated | - |
| West Adams Preparatory High School 9-12 | 2,618 Students | 2.2 miles away | Not Yet Rated | - |
| School of Math and Science 9-12 | 409 Students | 2.2 miles away | Not Yet Rated | - |
| School of Engineering and Technology 9-12 | 403 Students | 2.2 miles away | Not Yet Rated | - |
| Santee Education Complex School 9-12 | 2,857 Students | 2.3 miles away | ![]() 5 out of 5 | |
| John Marshall High School 9-12 | 3,479 Students | 3.3 miles away | ![]() 5 out of 5 | |
| Theodore Roosevelt High School 9-12 | 3,819 Students | 3.3 miles away | ![]() 2.5 out of 5 | |
Compare This School To Nearby Schools ->
School Community Forum

Join a discussion about Belmont High School and talk to others in the community including students, parents, teachers, and administrators.
Popular Discussion Topics
- Admissions and Registration Questions (e.g. Dress Code and Discipline Policy)
- School Calendar and Upcoming Events (e.g. Graduation)
- After School Programs, Extracurricular Activities, and Athletics (e.g. Football)
- News and Announcements (e.g. Yearbook and Class Supply List Details)
- Graduate and Alumni Events (e.g. Organizing Class Reunions)
Navigation
Can't Find What You Are Looking For?
Rankings
Sponsored Links
K-12 Articles
Teaching Children Respect
Statistics prove that there are many different family types in today's society. Grandparents or a...
School's out for Recess
Recess used to be the best part of school; that and lunch. But today, a shocking two-thirds of...
Cutting Class
Depression is a very real problem for today's youth. When your spirit doesn't feel good, a lot of...


(4 / 5) 
