Sherman Oaks Center for Enriched Studies
Rating
Not Available
Not Available

4.5 out of 5 | 2 Reviews
Find Old Friends From Sherman Oaks Center for Enriched Studies
Use the form below to search for alumni from Sherman Oaks Center for Enriched Studies.
School Description
School Summary and Highlights
- Enrolls 1,827 elementary, middle, and high school students from grades 4-12
- Ranks 34th out of 1,197 high schools in CA.
- 2010 Overall School AYP Met Status: No
Additional Contact Information
- Mailing Address: 18605 Erwin St., Reseda, CA 91335
School Operational Details
- Alternative School
- Title I EligibleAll students of this school are eligible for participation in authorized programs.
School District Details
- Los Angeles Unified School District
- Per-Pupil Spending: $11,357
- Graduation Rate: 48.8%
- Dropout Rate: 6.8%
- Students Per Teacher: 21.3
- Enrolled Students: 667,870
Faculty Details and Student Enrollment
Students and Faculty
- Total Students Enrolled: 1,827
- Total Full Time "Equivalent" Teachers: 63.3
- Average Student-To-Teacher Ratio: 28.9
Students Gender Breakdown
- Males: 897 (49.1%)
- Females: 930 (50.9%)
Free Lunch Student Eligibility Breakdown
- Eligible for Reduced Lunch: 222 (12.2%)
- Eligible for Free Lunch: 612 (33.5%)
- Eligible for Either Reduced or Free Lunch: 834 (45.6%)
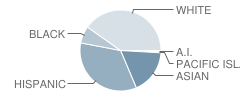
Student Enrollment Distribution by Race / Ethnicity
| Number | Percent | |
|---|---|---|
| American Indian | 11 | 0.6% |
| Black | 125 | 6.8% |
| Asian | 320 | 17.5% |
| Hispanic | 618 | 33.8% |
| White | 722 | 39.5% |
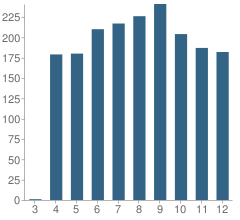
Number of Students Per Grade
| Number | Percent | |
|---|---|---|
| 3rd Grade | 1 | 0.05% |
| 4th Grade | 179 | 9.8% |
| 5th Grade | 180 | 9.9% |
| 6th Grade | 210 | 11.5% |
| 7th Grade | 217 | 11.9% |
| 8th Grade | 226 | 12.4% |
| 9th Grade | 241 | 13.2% |
| 10th Grade | 204 | 11.2% |
| 11th Grade | 187 | 10.2% |
| 12th Grade | 182 | 10.0% |
Graduates Information (2010)
Graduation Rate
School:
96.4%
District:
69.1%
State:
78.6%
Teacher Education Background (2009)
Percent With Ph.D.
School:
1.3%
District:
3.7%
Percent With Master's Degree
School:
9.2%
District:
26.9%
Percent With Bachelor's Degree
School:
9.2%
District:
31.9%
Teacher Credentials & Experience (2009)
Percent of Teachers With Credentials: 100.0%
Number of Certificated Staff: 76.0
Average Number of Years of Teacher Experience: 16.9
Average Age
School:
49.7
District:
46.7
Source: CA Department of Education, Source: NCES 2009-2010
School Ratings and Reviews
Overall Rating: 4.5

4.5 out of 5 | 2 Reviews
The Overall Rating is the school's average rating from parents, students, school faculty and staff. The highest rating is five apples and the lowest is one apple.
Share Your Review About This School
2 reviews for Sherman Oaks Center for Enriched Studies
- Reviewed by Parent/Guardian on April 27, 2010
- Rating:
 (5 / 5) Flag as inappropriate
 - Swearing? Kissing? Gee...I'll bet my life that most if not all kids have been exposed to this at home or on tv by the time they are in 4th grade if not long before.
- Reviewed by Parent/Guardian on December 23, 2009
- Rating:
 (4 / 5) Flag as inappropriate
 - SOCES is a great school, for middle schoolers and high schoolers, but I do not feel like it is appropriate for elementry school students. Fourth and fifth graders should not be exposed to the same things that high schoolers are (namely swearing and seeing older students make-out). I understand other parent's dilemma and the worry about where your child is going to go for high school, but they are just too young for this enviroment.
School Map and Similar Schools Nearby
Click to Activate Map of Nearby School Campuses
Private
Public
This School
Similar Schools Nearby
| Zane Grey Continuation School 9-12 | 169 Students | 0.6 miles away | Not Yet Rated | |
| John R. Wooden High School 9-12 | 70 Students | 2.0 miles away | Not Yet Rated | |
| Henry David Thoreau Continuation School 9-12 | 86 Students | 2.1 miles away | Not Yet Rated | |
| Independence Continuation School 9-12 | 114 Students | 2.1 miles away | Not Yet Rated | |
| Valley Alternative Magnet School KG-12 | 602 Students | 2.2 miles away | Not Yet Rated | |
| Owensmouth Continuation School 9-12 | 83 Students | 3.8 miles away | Not Yet Rated | |
| Will Rogers Continuation School 9-12 | 137 Students | 4.8 miles away | Not Yet Rated | |
| Albert Einstein Continuation School 9-12 | 89 Students | 5.1 miles away | Not Yet Rated | |
| Aggeler Community Day School 7-12 | 100 Students | 5.1 miles away | Not Yet Rated | |
| Cal Burke High School 9-12 | 148 Students | 5.4 miles away |  5 out of 5 | |
Compare This School To Nearby Schools ->
School Community Forum

Join a discussion about Sherman Oaks Center for Enriched Studies and talk to others in the community including students, parents, teachers, and administrators.
Popular Discussion Topics
- Admissions and Registration Questions (e.g. Dress Code and Discipline Policy)
- School Calendar and Upcoming Events (e.g. Graduation)
- After School Programs, Extracurricular Activities, and Athletics (e.g. Football)
- News and Announcements (e.g. Yearbook and Class Supply List Details)
- Graduate and Alumni Events (e.g. Organizing Class Reunions)
Navigation
Can't Find What You Are Looking For?
Rankings
Nearby Cities
Sponsored Links
K-12 Articles

Is Your Child's Teacher a Bully?
We've all heard about kids being bullied by peers. Kids taunt, tease, pull hair, shove and push...
We've all heard about kids being bullied by peers. Kids taunt, tease, pull hair, shove and push...

Help Your Child Achieve Success in Middle School
Middle school is for children between the ages of 10 and 14 years. At this time children begin to...
Middle school is for children between the ages of 10 and 14 years. At this time children begin to...

Beating the Summer Slump
"The Summer Slump", teachers call it. It happens every year. It makes its way into lesson plans...
"The Summer Slump", teachers call it. It happens every year. It makes its way into lesson plans...