Alhambra High School

5 out of 5 | 1 Review
Find Old Friends From Alhambra High School
Use the form below to search for alumni from Alhambra High School.
School Description
School Summary and Highlights
- Enrolls 1,280 high school students from grades 9-12
- Ranks 46th out of 1,197 high schools in CA.
- 2010 Overall School AYP Met Status: Yes
Additional Contact Information
- Mailing Address: 150 E St., Martinez, CA 94553
School District Details
- Martinez Unified School District
- Per-Pupil Spending: $8,087
- Graduation Rate: 84.7%
- Dropout Rate: 1.7%
- Students Per Teacher: 21.1
- Enrolled Students: 4,034
Faculty Details and Student Enrollment
Students and Faculty
- Total Students Enrolled: 1,280
- Total Full Time "Equivalent" Teachers: 56.4
- Average Student-To-Teacher Ratio: 22.7
Students Gender Breakdown
- Males: 648 (50.6%)
- Females: 632 (49.4%)
Free Lunch Student Eligibility Breakdown
- Eligible for Reduced Lunch: 59 (4.6%)
- Eligible for Free Lunch: 166 (13.0%)
- Eligible for Either Reduced or Free Lunch: 225 (17.6%)
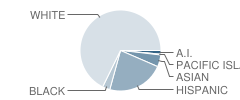
Student Enrollment Distribution by Race / Ethnicity

| Number | Percent | |
|---|---|---|
| American Indian | 19 | 1.5% |
| Black | 37 | 2.9% |
| Asian | 58 | 4.5% |
| Hispanic | 272 | 21.3% |
| White | 807 | 63.0% |
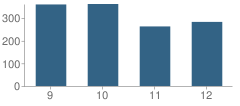
Number of Students Per Grade

| Number | Percent | |
|---|---|---|
| 9th Grade | 360 | 28.1% |
| 10th Grade | 362 | 28.3% |
| 11th Grade | 263 | 20.5% |
| 12th Grade | 283 | 22.1% |
| Ungraded | 12 | 0.9% |
Graduates Information (2010)
Graduation Rate
School:
96.4%
District:
89.5%
State:
78.6%
Teacher Education Background (2009)
Percent With Master's Degree
School:
15.2%
District:
42.9%
Percent With Bachelor's Degree
School:
6.1%
District:
7.1%
Teacher Credentials & Experience (2009)
Percent of Teachers With Emergency Credentials: 1.7%
Percent of Teachers With Credentials: 94.9%
Number of Certificated Staff: 66.0
Average Number of Years of Teacher Experience: 15.3
Average Age
School:
45.2
District:
51.2
Source: CA Department of Education, Source: NCES 2009-2010
Sponsored Links
Test Scores and Performance Information
Overall School Rating
How is this determined?
The overall school rating shows that Alhambra High School performed on average much better than most other schools across the state on CST state exams in the following subjects:
- CST Algebra I
- CST Algebra II
- CST Biology
- CST Chemistry
- CST English-Language Arts
- CST General Mathematics
- CST Geometry
- CST Integrated Math 1
- CST Science
- CST Summative High School Math
- CST U.S. History
- CST World History
AYP Results (2010)
Overall AYP Met: Yes
ELA AYP Met: Yes
Math AYP Met: Yes
ACT Exam Results (2009)
Percent of Students Taking ACT Exam: 9.7%
Average Combined Score: 24.0
Percent Scoring At or Above 21: 75.0%
SAT Exam Results (2009)
Percent of Students Taking SAT Exam: 44.1%
Average Combined Score: 1,591.3
Critical Reading Average: 515.0
Math Average: 552.4
Writing Average: 523.9
Percent Scoring At or Above 1500: 64.6%
CST - Test Proficiency by Grade and Subject
Grade 9 - % of students at or above proficiency
| School | District | State | |
|---|---|---|---|
| CST Algebra I Test | |||
| 2010 | 59.0% | 58.0% | 22.0% |
| 2009 | 39.0% | 38.0% | 21.0% |
| 2008 | 29.0% | 27.0% | 18.0% |
| CST Algebra II Test | |||
| 2010 | 100.0% | 100.0% | 69.0% |
| CST Biology Test | |||
| 2010 | 93.0% | 89.0% | 55.0% |
| 2009 | 85.0% | 85.0% | 51.0% |
| 2008 | 88.0% | 84.0% | 52.0% |
| CST English-Language Arts Test | |||
| 2010 | 66.0% | 65.0% | 54.0% |
| 2009 | 69.0% | 68.0% | 50.0% |
| 2008 | 59.0% | 58.0% | 49.0% |
| CST General Mathematics Test | |||
| 2010 | 42.0% | 39.0% | 17.0% |
| 2009 | 37.0% | 37.0% | 17.0% |
| 2008 | 35.0% | 32.0% | 18.0% |
| CST Geometry Test | |||
| 2010 | 75.0% | 75.0% | 46.0% |
| 2009 | 64.0% | 63.0% | 47.0% |
| 2008 | 70.0% | 70.0% | 43.0% |
Grade 10 - % of students at or above proficiency
| School | District | State | |
|---|---|---|---|
| CST Algebra I Test | |||
| 2010 | 33.0% | 26.0% | 12.0% |
| 2009 | 26.0% | 22.0% | 11.0% |
| 2008 | 16.0% | 15.0% | 9.0% |
| CST Algebra II Test | |||
| 2010 | 76.0% | 75.0% | 40.0% |
| 2009 | 70.0% | 70.0% | 37.0% |
| 2008 | 68.0% | 68.0% | 36.0% |
| CST Biology Test | |||
| 2010 | 65.0% | 58.0% | 38.0% |
| 2009 | 67.0% | 63.0% | 34.0% |
| 2008 | 56.0% | 54.0% | 35.0% |
| CST Chemistry Test | |||
| 2010 | 73.0% | 73.0% | 47.0% |
| 2009 | 74.0% | 74.0% | 44.0% |
| 2008 | 60.0% | 60.0% | 41.0% |
| CST English-Language Arts Test | |||
| 2010 | 64.0% | 58.0% | 45.0% |
| 2009 | 58.0% | 52.0% | 44.0% |
| 2008 | 49.0% | 47.0% | 41.0% |
| CST Geometry Test | |||
| 2010 | 49.0% | 49.0% | 14.0% |
| 2009 | 48.0% | 46.0% | 14.0% |
| 2008 | 37.0% | 37.0% | 12.0% |
| CST Science Test | |||
| 2010 | 61.0% | 55.0% | 46.0% |
| 2009 | 54.0% | 49.0% | 44.0% |
| 2008 | 45.0% | 42.0% | 40.0% |
| CST World History Test | |||
| 2010 | 61.0% | 56.0% | 42.0% |
| 2009 | 53.0% | 49.0% | 38.0% |
| 2008 | 43.0% | 41.0% | 33.0% |
| CST Integrated Math 1 Test | |||
| 2008 | 25.0% | 25.0% | 10.0% |
Grade 11 - % of students at or above proficiency
| School | District | State | |
|---|---|---|---|
| CST Algebra I Test | |||
| 2010 | 13.0% | 11.0% | 8.0% |
| 2009 | 5.0% | 5.0% | 8.0% |
| CST Algebra II Test | |||
| 2010 | 51.0% | 51.0% | 14.0% |
| 2009 | 31.0% | 31.0% | 12.0% |
| 2008 | 33.0% | 34.0% | 11.0% |
| CST Biology Test | |||
| 2010 | 80.0% | 73.0% | 46.0% |
| 2009 | 66.0% | 53.0% | 41.0% |
| 2008 | 68.0% | 55.0% | 39.0% |
| CST Chemistry Test | |||
| 2010 | 45.0% | 45.0% | 30.0% |
| 2009 | 40.0% | 40.0% | 27.0% |
| 2008 | 42.0% | 42.0% | 25.0% |
| CST English-Language Arts Test | |||
| 2010 | 62.0% | 54.0% | 42.0% |
| 2009 | 58.0% | 49.0% | 40.0% |
| 2008 | 53.0% | 45.0% | 37.0% |
| CST Geometry Test | |||
| 2010 | 29.0% | 28.0% | 6.0% |
| 2009 | 22.0% | 22.0% | 7.0% |
| 2008 | 22.0% | 21.0% | 6.0% |
| CST Summative High School Math Test | |||
| 2010 | 73.0% | 73.0% | 50.0% |
| 2009 | 56.0% | 56.0% | 47.0% |
| 2008 | 62.0% | 62.0% | 43.0% |
| CST U.S. History Test | |||
| 2010 | 61.0% | 51.0% | 45.0% |
| 2009 | 56.0% | 48.0% | 44.0% |
| 2008 | 52.0% | 43.0% | 38.0% |
| CST Integrated Math 1 Test | |||
| 2008 | 5.0% | 5.0% | 9.0% |
End of Course - % of students at or above proficiency
| School | District | State | |
|---|---|---|---|
| CST Algebra I Test | |||
| 2010 | 45.0% | 53.0% | 31.0% |
| 2009 | 30.0% | 33.0% | 28.0% |
| 2008 | 19.0% | 33.0% | 25.0% |
| CST Algebra II Test | |||
| 2010 | 71.0% | 71.0% | 31.0% |
| 2009 | 56.0% | 56.0% | 28.0% |
| 2008 | 55.0% | 55.0% | 27.0% |
| CST Biology Test | |||
| 2010 | 77.0% | 70.0% | 46.0% |
| 2009 | 74.0% | 69.0% | 42.0% |
| 2008 | 67.0% | 60.0% | 42.0% |
| CST Chemistry Test | |||
| 2010 | 61.0% | 61.0% | 38.0% |
| 2009 | 52.0% | 52.0% | 36.0% |
| 2008 | 49.0% | 49.0% | 32.0% |
| CST General Mathematics Test | |||
| 2010 | 42.0% | 38.0% | 27.0% |
| 2009 | 37.0% | 22.0% | 26.0% |
| 2008 | 35.0% | 19.0% | 27.0% |
| CST Geometry Test | |||
| 2010 | 53.0% | 52.0% | 27.0% |
| 2009 | 49.0% | 52.0% | 26.0% |
| 2008 | 47.0% | 46.0% | 24.0% |
| CST Summative High School Math Test | |||
| 2010 | 74.0% | 74.0% | 54.0% |
| 2009 | 56.0% | 56.0% | 50.0% |
| 2008 | 62.0% | 62.0% | 47.0% |
| CST World History Test | |||
| 2010 | 60.0% | 54.0% | 41.0% |
| 2009 | 53.0% | 47.0% | 38.0% |
| 2008 | 41.0% | 39.0% | 33.0% |
| CST Integrated Math 1 Test | |||
| 2008 | 10.0% | 10.0% | 11.0% |
Source: CA Department of Education 2009-2010
School Map and Similar Schools Nearby
Click to Activate Map of Nearby School Campuses
Private
Public
This School
Similar Schools Nearby
| Martinez Junior High School 6-8 | 918 Students | 0.9 miles away | Not Yet Rated | |
| College Park High School 9-12 | 2,034 Students | 4.3 miles away | Not Yet Rated | |
| Benicia High School 9-12 | 1,671 Students | 4.7 miles away | Not Yet Rated | |
| Mt. Diablo High School 9-12 | 1,610 Students | 5.5 miles away | ![]() 5 out of 5 | |
| John Swett High School 9-12 | 524 Students | 5.9 miles away | Not Yet Rated | |
| Hercules High School 9-12 | 1,008 Students | 6.4 miles away | ![]() 3 out of 5 | |
| Acalanes High School 9-12 | 1,371 Students | 7.0 miles away | Not Yet Rated | |
| Ygnacio Valley High School 9-12 | 1,343 Students | 7.6 miles away | ![]() 5 out of 5 | |
| Concord High School 9-12 | 1,591 Students | 8.1 miles away | Not Yet Rated | |
| Hogan High School 9-12 | 1,361 Students | 8.2 miles away | ![]() 3.5 out of 5 | |
Compare This School To Nearby Schools ->
School Community Forum

Join a discussion about Alhambra High School and talk to others in the community including students, parents, teachers, and administrators.
Popular Discussion Topics
- Admissions and Registration Questions (e.g. Dress Code and Discipline Policy)
- School Calendar and Upcoming Events (e.g. Graduation)
- After School Programs, Extracurricular Activities, and Athletics (e.g. Football)
- News and Announcements (e.g. Yearbook and Class Supply List Details)
- Graduate and Alumni Events (e.g. Organizing Class Reunions)
Navigation
Can't Find What You Are Looking For?
Rankings
Nearby Cities
Sponsored Links
K-12 Articles
Helping Your Child Leave the Nest
It's all come down to this: Eighteen years of good times and bad, and now your baby bird is ready...
Tips for Purchasing Back to School Supplies
In just a few days, kids from all over the US will be going back to school. Now is the time to take...
Teachers Packing Heat
After the recent school shootings (and thwarted school shootings) in the past month-just as after...


(5 / 5) 

