Marysville High School

No Reviews Yet
Find Old Friends From Marysville High School
Use the form below to search for alumni from Marysville High School.
School Description
School Summary and Highlights
- Enrolls 951 high school students from grades 9-12
- Ranks 522nd out of 1,197 high schools in CA.
- 2010 Overall School AYP Met Status: No
Additional Contact Information
- Mailing Address: 12 East 18th St., Marysville, CA 95901
School Operational Details
- Title I Eligible
School District Details
- Marysville Joint Unified School District
- Per-Pupil Spending: $9,420
- Graduation Rate: 70.8%
- Dropout Rate: 5.7%
- Students Per Teacher: 21.2
- Enrolled Students: 10,049
Faculty Details and Student Enrollment
Students and Faculty
- Total Students Enrolled: 951
- Total Full Time "Equivalent" Teachers: 44.5
- Average Student-To-Teacher Ratio: 21.4
Students Gender Breakdown
- Males: 457 (48.1%)
- Females: 494 (51.9%)
Free Lunch Student Eligibility Breakdown
- Eligible for Reduced Lunch: 81 (8.5%)
- Eligible for Free Lunch: 428 (45.0%)
- Eligible for Either Reduced or Free Lunch: 509 (53.5%)
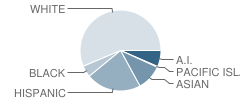
Student Enrollment Distribution by Race / Ethnicity

| Number | Percent | |
|---|---|---|
| American Indian | 62 | 6.5% |
| Black | 44 | 4.6% |
| Asian | 97 | 10.2% |
| Hispanic | 207 | 21.8% |
| White | 528 | 55.5% |
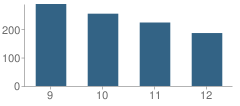
Number of Students Per Grade

| Number | Percent | |
|---|---|---|
| 9th Grade | 288 | 30.3% |
| 10th Grade | 254 | 26.7% |
| 11th Grade | 223 | 23.4% |
| 12th Grade | 186 | 19.6% |
Graduates Information (2010)
Graduation Rate
School:
95.0%
District:
77.0%
State:
78.6%
Teacher Education Background (2009)
Percent With Ph.D.
School:
2.0%
District:
3.3%
Percent With Master's Degree
School:
14.3%
District:
70.0%
Percent With Bachelor's Degree
School:
28.6%
District:
10.0%
Teacher Credentials & Experience (2009)
Percent of Teachers With Credentials: 93.8%
Number of Certificated Staff: 49.0
Average Number of Years of Teacher Experience: 16.3
Average Age
School:
44.4
District:
42.7
Source: CA Department of Education, Source: NCES 2009-2010
School Ratings and Reviews
Be The First To Review Marysville High School!
Sponsored Links
Test Scores and Performance Information
Overall School Rating
How is this determined?
The overall school rating shows that Marysville High School performed on average about the same as other schools across the state on CST state exams in the following subjects:
- CST Algebra I
- CST Algebra II
- CST Biology
- CST Chemistry
- CST Earth Science
- CST English-Language Arts
- CST General Mathematics
- CST Geometry
- CST Physics
- CST Science
- CST Summative High School Math
- CST U.S. History
- CST World History
AYP Results (2010)
Overall AYP Met: No
ELA AYP Met: No
Math AYP Met: Yes
Program Improvement (PI) Requirement Under NCLB (2010)
First Year PI Requirement was Implemented: 2010-2011
School's Placement Under NCLB: Year 1
ACT Exam Results (2009)
Percent of Students Taking ACT Exam: 4.3%
SAT Exam Results (2009)
Percent of Students Taking SAT Exam: 21.6%
Average Combined Score: 1,505.8
Critical Reading Average: 488.0
Math Average: 528.2
Writing Average: 489.6
Percent Scoring At or Above 1500: 42.2%
CST - Test Proficiency by Grade and Subject
Grade 9 - % of students at or above proficiency
| School | District | State | |
|---|---|---|---|
| CST Algebra I Test | |||
| 2010 | 27.0% | 14.0% | 22.0% |
| 2009 | 28.0% | 17.0% | 21.0% |
| 2008 | 31.0% | 17.0% | 18.0% |
| CST Biology Test | |||
| 2010 | 33.0% | 32.0% | 55.0% |
| 2009 | 31.0% | 28.0% | 51.0% |
| 2008 | 30.0% | 29.0% | 52.0% |
| CST English-Language Arts Test | |||
| 2010 | 55.0% | 47.0% | 54.0% |
| 2009 | 51.0% | 42.0% | 50.0% |
| 2008 | 50.0% | 42.0% | 49.0% |
| CST General Mathematics Test | |||
| 2010 | 12.0% | 9.0% | 17.0% |
| 2009 | 10.0% | 5.0% | 17.0% |
| 2008 | 10.0% | 9.0% | 18.0% |
| CST Geometry Test | |||
| 2010 | 23.0% | 30.0% | 46.0% |
| 2009 | 25.0% | 24.0% | 47.0% |
| 2008 | 24.0% | 23.0% | 43.0% |
| CST Algebra II Test | |||
| 2009 | 91.0% | 69.0% | 65.0% |
Grade 10 - % of students at or above proficiency
| School | District | State | |
|---|---|---|---|
| CST Algebra I Test | |||
| 2010 | 14.0% | 9.0% | 12.0% |
| 2009 | 8.0% | 10.0% | 11.0% |
| 2008 | 9.0% | 4.0% | 9.0% |
| CST Algebra II Test | |||
| 2010 | 57.0% | 37.0% | 40.0% |
| 2009 | 40.0% | 27.0% | 37.0% |
| 2008 | 66.0% | 39.0% | 36.0% |
| CST Biology Test | |||
| 2010 | 29.0% | 27.0% | 38.0% |
| 2009 | 10.0% | 30.0% | 34.0% |
| 2008 | 32.0% | 28.0% | 35.0% |
| CST Chemistry Test | |||
| 2010 | 59.0% | 52.0% | 47.0% |
| 2009 | 39.0% | 39.0% | 44.0% |
| 2008 | 49.0% | 49.0% | 41.0% |
| CST Earth Science Test | |||
| 2010 | 28.0% | 28.0% | 29.0% |
| 2009 | 19.0% | 21.0% | 23.0% |
| 2008 | 15.0% | 20.0% | 23.0% |
| CST English-Language Arts Test | |||
| 2010 | 45.0% | 35.0% | 45.0% |
| 2009 | 37.0% | 36.0% | 44.0% |
| 2008 | 41.0% | 32.0% | 41.0% |
| CST Geometry Test | |||
| 2010 | 5.0% | 10.0% | 14.0% |
| 2009 | 5.0% | 8.0% | 14.0% |
| 2008 | 3.0% | 4.0% | 12.0% |
| CST Science Test | |||
| 2010 | 44.0% | 36.0% | 46.0% |
| 2009 | 31.0% | 36.0% | 44.0% |
| 2008 | 32.0% | 31.0% | 40.0% |
| CST World History Test | |||
| 2010 | 40.0% | 37.0% | 42.0% |
| 2009 | 29.0% | 37.0% | 38.0% |
| 2008 | 37.0% | 36.0% | 33.0% |
Grade 11 - % of students at or above proficiency
| School | District | State | |
|---|---|---|---|
| CST Algebra II Test | |||
| 2010 | 40.0% | 20.0% | 14.0% |
| 2009 | 26.0% | 16.0% | 12.0% |
| 2008 | 25.0% | 14.0% | 11.0% |
| CST Biology Test | |||
| 2010 | 47.0% | 39.0% | 46.0% |
| 2009 | 35.0% | 37.0% | 41.0% |
| 2008 | 56.0% | 46.0% | 39.0% |
| CST Chemistry Test | |||
| 2010 | 21.0% | 34.0% | 30.0% |
| 2009 | 22.0% | 33.0% | 27.0% |
| 2008 | 15.0% | 29.0% | 25.0% |
| CST Earth Science Test | |||
| 2010 | 28.0% | 23.0% | 32.0% |
| 2009 | 19.0% | 16.0% | 26.0% |
| 2008 | 8.0% | 22.0% | 28.0% |
| CST English-Language Arts Test | |||
| 2010 | 41.0% | 33.0% | 42.0% |
| 2009 | 38.0% | 29.0% | 40.0% |
| 2008 | 39.0% | 34.0% | 37.0% |
| CST Geometry Test | |||
| 2010 | 11.0% | 10.0% | 6.0% |
| 2009 | - | - | - |
| 2008 | 6.0% | 4.0% | 6.0% |
| CST Physics Test | |||
| 2010 | 70.0% | 67.0% | 53.0% |
| 2009 | 55.0% | 61.0% | 50.0% |
| CST Summative High School Math Test | |||
| 2010 | 61.0% | 39.0% | 50.0% |
| 2009 | 54.0% | 41.0% | 47.0% |
| 2008 | 39.0% | 27.0% | 43.0% |
| CST U.S. History Test | |||
| 2010 | 44.0% | 39.0% | 45.0% |
| 2009 | 36.0% | 34.0% | 44.0% |
| 2008 | 35.0% | 37.0% | 38.0% |
End of Course - % of students at or above proficiency
| School | District | State | |
|---|---|---|---|
| CST Algebra I Test | |||
| 2010 | 22.0% | 23.0% | 31.0% |
| 2009 | 21.0% | 26.0% | 28.0% |
| 2008 | 22.0% | 20.0% | 25.0% |
| CST Algebra II Test | |||
| 2010 | 50.0% | 29.0% | 31.0% |
| 2009 | 37.0% | 24.0% | 28.0% |
| 2008 | 45.0% | 28.0% | 27.0% |
| CST Biology Test | |||
| 2010 | 36.0% | 32.0% | 46.0% |
| 2009 | 28.0% | 30.0% | 42.0% |
| 2008 | 35.0% | 31.0% | 42.0% |
| CST Chemistry Test | |||
| 2010 | 51.0% | 46.0% | 38.0% |
| 2009 | 36.0% | 38.0% | 36.0% |
| 2008 | 43.0% | 44.0% | 32.0% |
| CST Earth Science Test | |||
| 2010 | 27.0% | 25.0% | 33.0% |
| 2009 | 20.0% | 21.0% | 28.0% |
| 2008 | 12.0% | 23.0% | 28.0% |
| CST General Mathematics Test | |||
| 2010 | 12.0% | 22.0% | 27.0% |
| 2009 | 10.0% | 16.0% | 26.0% |
| 2008 | 10.0% | 17.0% | 27.0% |
| CST Geometry Test | |||
| 2010 | 13.0% | 18.0% | 27.0% |
| 2009 | 12.0% | 13.0% | 26.0% |
| 2008 | 11.0% | 10.0% | 24.0% |
| CST Physics Test | |||
| 2010 | 70.0% | 66.0% | 49.0% |
| 2009 | 55.0% | 62.0% | 46.0% |
| CST Summative High School Math Test | |||
| 2010 | 67.0% | 44.0% | 54.0% |
| 2009 | 63.0% | 44.0% | 50.0% |
| 2008 | 47.0% | 30.0% | 47.0% |
| CST World History Test | |||
| 2010 | 35.0% | 35.0% | 41.0% |
| 2009 | 29.0% | 36.0% | 38.0% |
| 2008 | 36.0% | 35.0% | 33.0% |
Source: CA Department of Education 2009-2010
School Map and Similar Schools Nearby
Click to Activate Map of Nearby School Campuses
Private
Public
This School
Similar Schools Nearby
| Yuba City High School 9-12 | 1,676 Students | 2.7 miles away | ![]() 4 out of 5 | |
| River Valley High School 9-12 | 1,869 Students | 4.3 miles away | ![]() 5 out of 5 | |
| Lindhurst High School 9-12 | 1,332 Students | 6.0 miles away | Not Yet Rated | |
| Sutter High School 9-12 | 707 Students | 9.0 miles away | Not Yet Rated | |
| Live Oak High School 9-12 | 535 Students | 9.2 miles away | Not Yet Rated | |
| Wheatland Union High School 9-12 | 747 Students | 12.9 miles away | Not Yet Rated | |
| Gridley High School 9-12 | 583 Students | 15.6 miles away | Not Yet Rated | |
| Sycamore Middle School 6-9 | 585 Students | 15.6 miles away | ![]() 2 out of 5 | |
| East Nicolaus High School 9-12 | 322 Students | 17.1 miles away | Not Yet Rated | |
| Las Plumas High School 9-12 | 1,418 Students | 22.6 miles away | ![]() 5 out of 5 | |
Compare This School To Nearby Schools ->
School Community Forum

Join a discussion about Marysville High School and talk to others in the community including students, parents, teachers, and administrators.
Popular Discussion Topics
- Admissions and Registration Questions (e.g. Dress Code and Discipline Policy)
- School Calendar and Upcoming Events (e.g. Graduation)
- After School Programs, Extracurricular Activities, and Athletics (e.g. Football)
- News and Announcements (e.g. Yearbook and Class Supply List Details)
- Graduate and Alumni Events (e.g. Organizing Class Reunions)
Navigation
Can't Find What You Are Looking For?
Rankings
Nearby Cities
Sponsored Links
K-12 Articles
Teacher Tenure: A Double-Edged Sword
Teacher Tenure (the policy making it almost impossible to fire teachers) has noble roots. It was...
Imho
I was watching Headline News's news ticker when I read something that made me LOL. The ticker said...
Nothing New Under the Sun
"I had to go through the same thing when I went to school." Every parent has uttered this phrase,...


