Taylor Middle School
Rating
Not Available
Not Available

5 out of 5 | 1 Review
Find Old Friends From Taylor Middle School
Use the form below to search for alumni from Taylor Middle School.
School Description
School Summary and Highlights
- Enrolls 852 middle school students from grades 6-8
- Ranks 215th out of 2,050 middle schools in CA.
- 2010 Overall School AYP Met Status: Yes
Additional Contact Information
- Mailing Address: 850 Taylor Blvd., Millbrae, CA 94030
School Operational Details
- Title I Eligible
School District Details
- Millbrae Elementary School District
- Per-Pupil Spending: $8,095
- Students Per Teacher: 20.3
- Enrolled Students: 2,176
Faculty Details and Student Enrollment
Students and Faculty
- Total Students Enrolled: 852
- Total Full Time "Equivalent" Teachers: 41.2
- Average Student-To-Teacher Ratio: 20.7
Students Gender Breakdown
- Males: 441 (51.8%)
- Females: 411 (48.2%)
Free Lunch Student Eligibility Breakdown
- Eligible for Reduced Lunch: 57 (6.7%)
- Eligible for Free Lunch: 85 (10.0%)
- Eligible for Either Reduced or Free Lunch: 142 (16.7%)
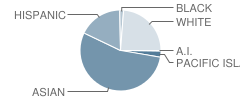
Student Enrollment Distribution by Race / Ethnicity
| Number | Percent | |
|---|---|---|
| American Indian | 3 | 0.4% |
| Black | 13 | 1.5% |
| Asian | 434 | 50.9% |
| Hispanic | 141 | 16.5% |
| White | 190 | 22.3% |
Number of Students Per Grade

| Number | Percent | |
|---|---|---|
| 6th Grade | 266 | 31.2% |
| 7th Grade | 309 | 36.3% |
| 8th Grade | 277 | 32.5% |
Teacher Education Background (2009)
Percent With Ph.D.
School:
6.5%
District:
8.3%
Percent With Master's Degree
School:
39.1%
District:
33.3%
Percent With Bachelor's Degree: 17.4%
Teacher Credentials & Experience (2009)
Percent of Teachers With Credentials: 97.6%
Number of Certificated Staff: 46.0
Average Number of Years of Teacher Experience: 11.4
Average Age
School:
41.4
District:
45.3
Source: CA Department of Education, Source: NCES 2009-2010
School Ratings and Reviews
Overall Rating: 5

5 out of 5 | 1 Review
The Overall Rating is the school's average rating from parents, students, school faculty and staff. The highest rating is five apples and the lowest is one apple.
Share Your Review About This School
1 review for Taylor Middle School
- Reviewed by Former Student on November 29, 2006
- Rating:
 (5 / 5) Flag as inappropriate
 - This is a great school! I went there for my middle school years and had great fun and education. The teachers are nice but also very fair and strict. I am now about to go into college and I think that me going to taylor middle school made high school easier! I give this school an A+ for everything!
School Map and Similar Schools Nearby
Click to Activate Map of Nearby School Campuses
Private
Public
This School
Similar Schools Nearby
| Burlingame Intermediate School 6-8 | 827 Students | 1.2 miles away | Not Yet Rated | |
| El Crystal Elementary School KG-6 | 237 Students | 1.2 miles away | Not Yet Rated | |
| Parkside Intermediate School 7-8 | 516 Students | 1.5 miles away | Not Yet Rated | |
| Belle Air Elementary School KG-6 | 447 Students | 1.7 miles away | Not Yet Rated | |
| Allen (Decima M.) Elementary School KG-6 | 357 Students | 1.9 miles away | Not Yet Rated | |
| John Muir Elementary School KG-6 | 337 Students | 2.1 miles away |  5 out of 5 | |
| Crestmoor Elementary School KG-6 | 225 Students | 2.5 miles away | 5 out of 5 | |
| Crocker Middle School 6-8 | 493 Students | 3.1 miles away | 5 out of 5 | |
| Rollingwood Elementary School KG-6 | 256 Students | 3.2 miles away | Not Yet Rated | |
| Portola Elementary School KG-6 | 245 Students | 3.3 miles away |  4 out of 5 | |
Compare This School To Nearby Schools ->
School Community Forum

Join a discussion about Taylor Middle School and talk to others in the community including students, parents, teachers, and administrators.
Popular Discussion Topics
- Admissions and Registration Questions (e.g. Dress Code and Discipline Policy)
- School Calendar and Upcoming Events (e.g. Graduation)
- After School Programs, Extracurricular Activities, and Athletics (e.g. Football)
- News and Announcements (e.g. Yearbook and Class Supply List Details)
- Graduate and Alumni Events (e.g. Organizing Class Reunions)
Navigation
Can't Find What You Are Looking For?
Rankings
Nearby Cities
Sponsored Links
K-12 Articles

Teaching Your Child Study Skills
Many children who have the capability to get good grades experience frustration because of low...
Many children who have the capability to get good grades experience frustration because of low...

School Violence: Can It Be Stopped
It's a fact that violence in schools is prevalent in today's society. We hear of school shootings,...
It's a fact that violence in schools is prevalent in today's society. We hear of school shootings,...

Bullycide: What is It and How Can It Be Prevented?
Disclaimer: This article expresses my opinion that has been formed by personal experience and...
Disclaimer: This article expresses my opinion that has been formed by personal experience and...