Clinton Christian Academy
- Grades: PK-12
- Student Enrollment: 29
Familiar With This School? Help Others By Posting Your Review

5 out of 5 | 1 Review
- Address
- 801 S Mulberry St
- Clinton, IL 61727
- Phone
- (217) 935-9414
Find Old Friends From Clinton Christian Academy
Use the form below to search for alumni from Clinton Christian Academy.
School Description
Clinton Christian Academy enrolls 29 school students from grades PK-12. It is located in Clinton, IL, which is a medium sized city with a median household income of $36,279.
School Operational Details
- Students Have Access to a Library or Media Center
School Days and Hours
- School Days Per Year: 172Note: Kindergarten Operates Five Days Per Week
- School Hours Per Day: 7Note: Kindergarten Operates on a Full Day Schedule
School Religious Orientation
- Baptist
School Associations
- Accelerated Christian Education (ACE) or (School of Tomorrow)
- Association of Christian Teachers and Schools (ACTS)
Similar Schools Nearby
| Cornerstone Christian Academy of Mclean County PK-12 | 443 Students | 22.6 miles away | Not Yet Rated | - |
| Youthbuild Academy 12 | 29 Students | 22.9 miles away | Not Yet Rated | - |
| Central Catholic High School 9-12 | 408 Students | 24.1 miles away | Not Yet Rated | - |
Compare Nearby Schools ->
Click To Activate School Map
This School
Public
Private
School Ratings and Reviews
Overall Rating

5 out of 5 | 1 Review
The Overall Rating is the school's average rating from parents, students, school faculty and staff. The highest rating is five apples and the lowest is one apple.
Share Your Review About This School
Help others in the community find the best school for their children by rating this school and writing a detailed review of your experiences.
1 review for Clinton Christian Academy
- Reviewed by Parent/Guardian on February 28, 2010
- Rating:
 (5 / 5) Flag as inappropriate
 - I would like to see how to get my son into this school
Faculty Details and Student Enrollment
Students and Faculty
- Total Students Enrolled: 29
- Total Full Time "Equivalent" Teachers: 2.9Full-Time Teachers: 2Part-Time Teachers: 1
- Average Student-To-Teacher Ratio: 7.9
- Percent Minority Students: 6.9%
Students Gender Breakdown
- Males: 20 (69.0%)
- Females: 9 (31.0%)
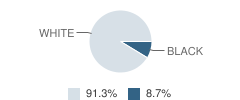
Student Enrollment Distribution by Race / Ethnicity
| Number | Percent | |
|---|---|---|
| American Indian | - | - |
| Black | 2 | 6.9% |
| Asian | - | - |
| Hispanic | - | - |
| White | 21 | 72.4% |
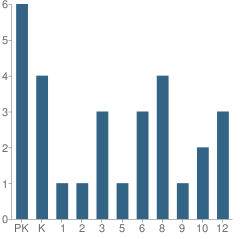
Number of Students Per Grade
| Number | Percent | |
|---|---|---|
| Pre-Kindergarten | 6 | 20.7% |
| Kindergarten | 4 | 13.8% |
| 1st Grade | 1 | 3.4% |
| 2nd Grade | 1 | 3.4% |
| 3rd Grade | 3 | 10.3% |
| 5th Grade | 1 | 3.4% |
| 6th Grade | 3 | 10.3% |
| 8th Grade | 4 | 13.8% |
| 9th Grade | 1 | 3.4% |
| 10th Grade | 2 | 6.9% |
| 12th Grade | 3 | 10.3% |
Source: IL Department of Education, Source: NCES 2009-2010
Sponsored Links
Nearby Cities
Navigation
Can't Find What You Are Looking For?
K-12 Articles

Special Needs Education: Your Child, Your Rights
Many children today have special needs that make it difficult for them to learn. It’s imperative...
Many children today have special needs that make it difficult for them to learn. It’s imperative...

Helping Your Learning Disabled Child
Thousands of children in America struggle to learn on a daily basis. Many of them have invisible...
Thousands of children in America struggle to learn on a daily basis. Many of them have invisible...

The Impact on Adopted Children at School
Children who are adopted can be affected both academically and socially at school. Many times...
Children who are adopted can be affected both academically and socially at school. Many times...
Get School Listings On Your Site
- The Widget Offers:
- - Searching By City or Zip
- - Public & Private Schools
- - School Ratings & Grades
- - Simple Embedding Code
- Great For:
- - Real Estate Blogs
- - Education or School Blogs
- - School Websites
