Buncombe Consolidated School District 43
- PO BOX 40
- BUNCOMBE, IL 62912
- (618) 658-8830
District Rating (FAQ)
District Information
District Overview
| District | State Average | |
|---|---|---|
| Graduation Rate | - | 80.4% |
| Dropout Rate | - | 5.2% |
| Per Pupil Spending | $9,127 | $11,055 |
| Students Per Teacher | 11.2 | 15.6 |
| Number of Schools | 1 | - |
| Number of Students | 67 | - |
| Number of (FTE) Teachers | 6 | - |
Student Enrollment (2009-2010)
| Students | Student/Teacher Ratio | |
|---|---|---|
| Total Student Enrollment | 67 | 11.2 |
Student Enrollment By Grade
| Students | |
|---|---|
| Prekindergarten Students | - |
| Kindergarten Students | 8 |
| 1st Grade Students | 14 |
| 2nd Grade Students | 9 |
| 3rd Grade Students | 6 |
| 4th Grade Students | 7 |
| 5th Grade Students | 11 |
| 6th Grade Students | 7 |
| 7th Grade Students | 8 |
| 8th Grade Students | 8 |
| 9th Grade Students | - |
| 10th Grade Students | - |
| 11th Grade Students | - |
| 12th Grade Students | - |
| Ungraded Students | - |
Student Enrollment By Race
| Students | |
|---|---|
| American Indian or Alaska Native | - |
| Asian or Pacific Islander | - |
| Hispanic | 2 |
| Black (Non-Hispanic) | - |
| White (Non-Hispanic) | 76 |
Student Enrollment By Gender
| Students | |
|---|---|
| Male | 44 |
| Female | 34 |
Faculty and Staff (2009-2010)
Teachers Per Grade Level
| Student/Teacher Ratio | ||
|---|---|---|
| Total Full Time Equivalent (FTE) Teachers | 6 | 11.2 |
| Prekindergarten Teachers | - | - |
| Kindergarten Teachers | 1 | - |
| Elementary Teachers | 5 | - |
| Secondary Teachers | - | - |
| Teachers of Ungraded Classes | - | - |
Instructional Faculty
| Instructional Aides | - |
| Instructional Coordinators and Supervisors | - |
Guidance Counselors & Directors
| Total Guidance Counselors & Directors | - |
| Elementary | - |
| Secondary | - |
| Other | - |
Librarians & Staff
| Librarians | - |
| Library Support Staff | - |
Administrators
| Total Administrators & Support Staff | 0 |
| Local Education Agency (LEA) Administrators | 0.6 |
| LEA Administrative Support Staff | - |
| School Administrators | - |
| School Administrative Support Staff | - |
| Student Support Services | - |
| Other Support Services Staff | - |
District Financial Details (2008)
Revenues For Education
| Percent of Total | ||
|---|---|---|
| Total Revenues | $607,000 | - |
| Total Local Revenues | $175,000 | 28.8% |
| Property Tax | $94,000 | 15.5% |
| Other School Systems | $6,000 | 1.0% |
| Cities and Counties | $4,000 | 0.7% |
| School Lunch | $6,000 | 1.0% |
| Interest Earnings | $1,000 | 0.2% |
| Miscellaneous | $3,000 | 0.5% |
| NCES and Census Revenue | $61,000 | 10.0% |
| Total State Revenues | $368,000 | 60.6% |
| General Formula Assistance | $273,000 | 45.0% |
| Special Education Programs | $25,000 | 4.1% |
| School Lunch Programs | $1,000 | 0.2% |
| Transportation Programs | $28,000 | 4.6% |
| Other Programs | $2,000 | 0.3% |
| State Revenues on Behalf - Employee Benefits | $37,000 | 6.1% |
| State Revenues on Behalf - Non-Employee Benefits | $2,000 | 0.3% |
| Total Federal Revenues | $64,000 | 10.5% |
| Through State - Title I | $22,000 | 3.6% |
| Through State - Child Nutrition Act | $19,000 | 3.1% |
| Through State - Other | $23,000 | 3.8% |
Expenditures For Education
| Percent of Total | ||
|---|---|---|
| Total Current Expenditures | $575,000 | - |
| Total Instruction Expenditures | $286,000 | 49.7% |
| Total Support Services Expenditures | $252,000 | 43.8% |
| General Administration Support | $84,000 | 13.8% |
| School Administration Support | $27,000 | 4.4% |
| Operation and Maintenance Support | $88,000 | 14.5% |
| Student Transportation Support | $49,000 | 8.1% |
| Other Support Services | $4,000 | 0.7% |
| Total Other Expenditures | $37,000 | 6.4% |
| Food Services | $37,000 | 6.1% |
Graduation and Dropout Details (2007-08)
Graduation Information
| Overall Graduation Rate | - | |
| Total Diploma Count | - | |
| Other High School Completion Certificate (OHC) Recipients | - |
Dropout Information
| Dropouts | Dropout Rate | |
|---|---|---|
| Total Grades 9-12 | - | - |
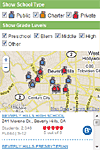
Map and Listings of Schools Within Buncombe Consolidated School District 43
Schools Summary:
- Schools: 1
- Students: 67
- Full-Time Equivalent Teachers: 6
Select School Filters:
Public
Charter
Preschools
Elementary
Middle
High
Other
| School Name (Sort |
Total Enrollment (Sort by) |
Student/Teacher Ratio (Sort by) |
School Reviews (Sort by) |
School Rating (Sort by) |
|---|---|---|---|---|
| BUNCOMBE CONS SCHOOL | ||||
164 Main St
Buncombe, IL Public | KG-8 | 78 | 14.2 |  Review This School |
|
Navigation
Can't Find What You Are Looking For?
Rankings
Nearby Cities
Get School Listings On Your Site
- The Widget Offers:
- - Searching By City or Zip
- - Public & Private Schools
- - School Ratings & Grades
- - Simple Embedding Code
- Great For:
- - Real Estate Blogs
- - Education or School Blogs
- - School Websites


