St Vincent's Special Needs Services School
- Grades: Unknown
- Student Enrollment: 64
Familiar With This School? Help Others By Posting Your Review
- Address
- 95 Merritt Blvd
- Trumbull, CT 06611
- Phone
- (203) 386-2741
School Description
St Vincent's Special Needs Services School enrolls 64 students in grade levels that do not adhere into a traditional K-12 system. It is located in Trumbull, CT, which is a medium sized city with a median household income of $79,507.
School Operational Details
- Special Education
School Days and Hours
- School Days Per Year: 210
- School Hours Per Day: 6
School Associations
- Council for Exceptional Children (CEC)
- National Association of Private Special Education Centers (NAPSEC)
Click To Activate School Map
This School
Public
Private
School Ratings and Reviews
Be The First To Review St Vincent's Special Needs Services School!
Help others in the community find the best school for their children by rating this school and writing a detailed review of your experiences.
Faculty Details and Student Enrollment
Students and Faculty
- Total Students Enrolled: 64
- Total Full Time "Equivalent" Teachers: 11.3Full-Time Teachers: 10Part-Time Teachers: 2
- Average Student-To-Teacher Ratio: 5.7
- Percent Minority Students: 62.5%
Students Gender Breakdown
- Males: 29 (45.3%)
- Females: 35 (54.7%)
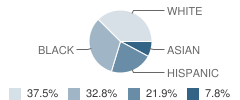
Student Enrollment Distribution by Race / Ethnicity

| Number | Percent | |
|---|---|---|
| American Indian | - | - |
| Black | 21 | 32.8% |
| Asian | 5 | 7.8% |
| Hispanic | 14 | 21.9% |
| White | 24 | 37.5% |
Source: CT Department of Education, Source: NCES 2009-2010
Sponsored Links
Nearby Cities
Navigation
Can't Find What You Are Looking For?
K-12 Articles

Homework Tips: Taking the Work out of Homework
Kids hate homework. It seems that almost every night of the week they are overloaded with...
Kids hate homework. It seems that almost every night of the week they are overloaded with...

Summer Safety Tips to Keep Kids Safe
It won’t be long until kids run from the school, shrieking in delight because they’re free for the...
It won’t be long until kids run from the school, shrieking in delight because they’re free for the...

Summer Advice
A few weeks ago, at the weekly after-school program I run through my local church, a group of...
A few weeks ago, at the weekly after-school program I run through my local church, a group of...
Get School Listings On Your Site
- The Widget Offers:
- - Searching By City or Zip
- - Public & Private Schools
- - School Ratings & Grades
- - Simple Embedding Code
- Great For:
- - Real Estate Blogs
- - Education or School Blogs
- - School Websites

