Fremont Elementary School
Rating
Not Available
Not Available

No Reviews Yet
Find Old Friends From Fremont Elementary School
Use the form below to search for alumni from Fremont Elementary School.
School Description
School Summary and Highlights
- Enrolls 708 elementary school students from grades KG-8
- Ranks 1116th out of 2,050 middle schools in CA.
- 2010 Overall School AYP Met Status: No
Additional Contact Information
- Mailing Address: 2001 South Elm St., Alhambra, CA 91803
School Operational Details
- Title I EligibleAll students of this school are eligible for participation in authorized programs.
School District Details
- Alhambra Unified School District
- Per-Pupil Spending: $9,424
- Graduation Rate: 80.2%
- Dropout Rate: 2.9%
- Students Per Teacher: 25.5
- Enrolled Students: 18,475
Faculty Details and Student Enrollment
Students and Faculty
- Total Students Enrolled: 708
- Total Full Time "Equivalent" Teachers: 32.0
- Average Student-To-Teacher Ratio: 22.1
Students Gender Breakdown
- Males: 369 (52.1%)
- Females: 339 (47.9%)
Free Lunch Student Eligibility Breakdown
- Eligible for Reduced Lunch: 102 (14.4%)
- Eligible for Free Lunch: 394 (55.6%)
- Eligible for Either Reduced or Free Lunch: 496 (70.1%)
Student Enrollment Distribution by Race / Ethnicity
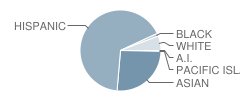
| Number | Percent | |
|---|---|---|
| American Indian | 2 | 0.3% |
| Black | 8 | 1.1% |
| Asian | 183 | 25.8% |
| Hispanic | 469 | 66.2% |
| White | 41 | 5.8% |
Number of Students Per Grade
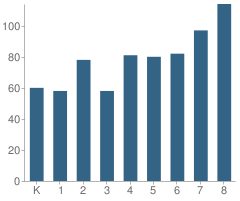
| Number | Percent | |
|---|---|---|
| Kindergarten | 60 | 8.5% |
| 1st Grade | 58 | 8.2% |
| 2nd Grade | 78 | 11.0% |
| 3rd Grade | 58 | 8.2% |
| 4th Grade | 81 | 11.4% |
| 5th Grade | 80 | 11.3% |
| 6th Grade | 82 | 11.6% |
| 7th Grade | 97 | 13.7% |
| 8th Grade | 114 | 16.1% |
Teacher Education Background (2009)
Percent With Ph.D.
School:
2.9%
District:
8.6%
Percent With Master's Degree
School:
20.6%
District:
22.9%
Percent With Bachelor's Degree
School:
8.8%
District:
1.4%
Teacher Credentials & Experience (2009)
Percent of Teachers With Credentials: 100.0%
Number of Certificated Staff: 34.0
Average Number of Years of Teacher Experience: 17.5
Average Age
School:
44.1
District:
44.1
Source: CA Department of Education, Source: NCES 2009-2010
School Ratings and Reviews
Be The First To Review Fremont Elementary School!
School Map and Similar Schools Nearby
Click to Activate Map of Nearby School Campuses
Private
Public
This School
Similar Schools Nearby
| Marguerita Elementary School KG-8 | 685 Students | 0.8 miles away | Not Yet Rated | |
| Monterey Highlands Elementary School KG-8 | 861 Students | 1.1 miles away | Not Yet Rated | |
| Emery Park Elementary School KG-8 | 558 Students | 1.2 miles away | Not Yet Rated | |
| Ramona Elementary School KG-8 | 955 Students | 1.3 miles away |  4.5 out of 5 | |
| Ynez Elementary School KG-8 | 914 Students | 1.4 miles away |  5 out of 5 | |
| Brightwood Elementary School KG-8 | 997 Students | 1.7 miles away | Not Yet Rated | |
| Park Elementary School KG-8 | 723 Students | 1.7 miles away | Not Yet Rated | |
| Repetto Elementary School KG-8 | 746 Students | 1.7 miles away | 5 out of 5 | |
| William Northrup Elementary School KG-8 | 731 Students | 2.0 miles away |  3 out of 5 | |
| Robert Hill Lane Elementary School KG-5 | 349 Students | 2.1 miles away | 5 out of 5 | |
Compare This School To Nearby Schools ->
School Community Forum

Join a discussion about Fremont Elementary School and talk to others in the community including students, parents, teachers, and administrators.
Popular Discussion Topics
- Admissions and Registration Questions (e.g. Dress Code and Discipline Policy)
- School Calendar and Upcoming Events (e.g. Graduation)
- After School Programs, Extracurricular Activities, and Athletics (e.g. Football)
- News and Announcements (e.g. Yearbook and Class Supply List Details)
- Graduate and Alumni Events (e.g. Organizing Class Reunions)
Navigation
Can't Find What You Are Looking For?
Rankings
Nearby Cities
Sponsored Links
K-12 Articles

Educators and Childhood Obesity
Obesity in childhood is rising to epidemic proportions in America and educators should be...
Obesity in childhood is rising to epidemic proportions in America and educators should be...

The Difference Between Boys and Girls
Boys and girls are different. Give a toddler girl a G.I. Joe and she'll probably try to mother it....
Boys and girls are different. Give a toddler girl a G.I. Joe and she'll probably try to mother it....

Everyone Loves Going to the Doctor and Dentist
Going to the doctor or dentist can be traumatic for children of all ages. Many adults do not...
Going to the doctor or dentist can be traumatic for children of all ages. Many adults do not...