Hamilton Elementary School
Rating
Not Available
Not Available

No Reviews Yet
Find Old Friends From Hamilton Elementary School
Use the form below to search for alumni from Hamilton Elementary School.
School Description
School Summary and Highlights
- Enrolls 543 elementary school students from grades KG-8
- Ranks 1806th out of 2,050 middle schools in CA.
- 2010 Overall School AYP Met Status: No
Additional Contact Information
- Mailing Address: 57550 Mitchell Rd., Anza, CA 92539
School Operational Details
- Title I EligibleAll students of this school are eligible for participation in authorized programs.
School District Details
- Hemet Unified School District
- Per-Pupil Spending: $8,845
- Graduation Rate: 79.2%
- Dropout Rate: 4.7%
- Students Per Teacher: 23.1
- Enrolled Students: 22,083
Faculty Details and Student Enrollment
Students and Faculty
- Total Students Enrolled: 543
- Total Full Time "Equivalent" Teachers: 26.5
- Average Student-To-Teacher Ratio: 20.5
Students Gender Breakdown
- Males: 280 (51.6%)
- Females: 263 (48.4%)
Free Lunch Student Eligibility Breakdown
- Eligible for Reduced Lunch: 69 (12.7%)
- Eligible for Free Lunch: 358 (65.9%)
- Eligible for Either Reduced or Free Lunch: 427 (78.6%)
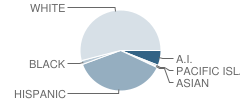
Student Enrollment Distribution by Race / Ethnicity
| Number | Percent | |
|---|---|---|
| American Indian | 33 | 6.1% |
| Black | 9 | 1.7% |
| Asian | 3 | 0.6% |
| Hispanic | 202 | 37.2% |
| White | 291 | 53.6% |
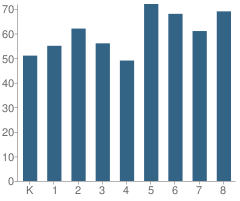
Number of Students Per Grade
| Number | Percent | |
|---|---|---|
| Kindergarten | 51 | 9.4% |
| 1st Grade | 55 | 10.1% |
| 2nd Grade | 62 | 11.4% |
| 3rd Grade | 56 | 10.3% |
| 4th Grade | 49 | 9.0% |
| 5th Grade | 72 | 13.3% |
| 6th Grade | 68 | 12.5% |
| 7th Grade | 61 | 11.2% |
| 8th Grade | 69 | 12.7% |
Teacher Education Background (2009)
Percent With Master's Degree
School:
17.2%
District:
35.2%
Percent With Bachelor's Degree
School:
10.3%
District:
3.8%
Teacher Credentials & Experience (2009)
Percent of Teachers With Emergency Credentials: 3.7%
Percent of Teachers With Credentials: 100.0%
Number of Certificated Staff: 29.0
Average Number of Years of Teacher Experience: 8.6
Average Age
School:
40.9
District:
44.8
Source: CA Department of Education, Source: NCES 2009-2010
School Ratings and Reviews
Be The First To Review Hamilton Elementary School!
School Map and Similar Schools Nearby
Click to Activate Map of Nearby School Campuses
Private
Public
This School
Similar Schools Nearby
| Idyllwild Elementary School KG-8 | 318 Students | 12.2 miles away |  5 out of 5 | |
| Cottonwood Elementary School KG-8 | 215 Students | 15.9 miles away | Not Yet Rated | |
| Cahuilla Elementary School KG-5 | 578 Students | 17.9 miles away | 5 out of 5 | |
| Rancho Mirage Elementary School KG-5 | 511 Students | 18.0 miles away | Not Yet Rated | |
| Valle Vista Elementary School KG-5 | 716 Students | 18.1 miles away | Not Yet Rated | |
| Cathedral City Elementary School KG-5 | 795 Students | 18.4 miles away | 5 out of 5 | |
| Cielo Vista Elementary School KG-5 | 541 Students | 19.1 miles away | 5 out of 5 | |
| Warner Elementary School KG-5 | 102 Students | 19.3 miles away | Not Yet Rated | |
| Bautista Creek Elementary School KG-5 | 928 Students | 19.6 miles away | Not Yet Rated | |
| Katherine Finchy Elementary School KG-5 | 628 Students | 19.7 miles away | Not Yet Rated | |
Compare This School To Nearby Schools ->
School Community Forum

Join a discussion about Hamilton Elementary School and talk to others in the community including students, parents, teachers, and administrators.
Popular Discussion Topics
- Admissions and Registration Questions (e.g. Dress Code and Discipline Policy)
- School Calendar and Upcoming Events (e.g. Graduation)
- After School Programs, Extracurricular Activities, and Athletics (e.g. Football)
- News and Announcements (e.g. Yearbook and Class Supply List Details)
- Graduate and Alumni Events (e.g. Organizing Class Reunions)
Navigation
Can't Find What You Are Looking For?
Rankings
Nearby Cities
Sponsored Links
K-12 Articles

School's out for Recess
Recess used to be the best part of school; that and lunch. But today, a shocking two-thirds of...
Recess used to be the best part of school; that and lunch. But today, a shocking two-thirds of...

Exciting School Lunch Ideas
Earlier this week I had reason to drop by my grandsons’ school at lunch time. While waiting for the...
Earlier this week I had reason to drop by my grandsons’ school at lunch time. While waiting for the...

National Memories
Few events are seared into our memory, and bring the country together-not as Democrat and...
Few events are seared into our memory, and bring the country together-not as Democrat and...