California Virtual Academy at Sonoma

No Reviews Yet
Find Old Friends From California Virtual Academy at Sonoma
Use the form below to search for alumni from California Virtual Academy at Sonoma.
School Description
School Summary and Highlights
- Enrolls 975 elementary, middle, and high school students from grades KG-12
- Ranks 709th out of 1,197 high schools in CA.
- 2010 Overall School AYP Met Status: No
Additional Contact Information
- Mailing Address: 170 Liberty School Rd., Petaluma, CA 94952
School Operational Details
- Title I EligibleAll students of this school are eligible for participation in authorized programs.
- Charter School
School District Details
- Liberty Elementary School District
- Per-Pupil Spending: $8,308
- Dropout Rate: 50.0%
- Students Per Teacher: 24.2
- Enrolled Students: 1,172
Faculty Details and Student Enrollment
Students and Faculty
- Total Students Enrolled: 975
- Total Full Time "Equivalent" Teachers: 38.6
- Average Student-To-Teacher Ratio: 25.2
Students Gender Breakdown
- Males: 491 (50.4%)
- Females: 484 (49.6%)
Free Lunch Student Eligibility Breakdown
- Eligible for Reduced Lunch: 74 (7.6%)
- Eligible for Free Lunch: 152 (15.6%)
- Eligible for Either Reduced or Free Lunch: 226 (23.2%)
Student Enrollment Distribution by Race / Ethnicity
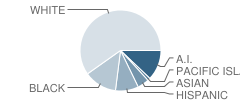
| Number | Percent | |
|---|---|---|
| American Indian | 116 | 11.9% |
| Black | 126 | 12.9% |
| Asian | 47 | 4.8% |
| Hispanic | 89 | 9.1% |
| White | 556 | 57.0% |
Number of Students Per Grade
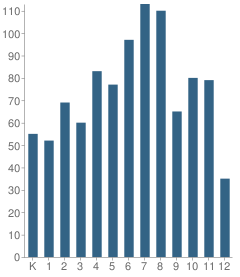
| Number | Percent | |
|---|---|---|
| Kindergarten | 55 | 5.6% |
| 1st Grade | 52 | 5.3% |
| 2nd Grade | 69 | 7.1% |
| 3rd Grade | 60 | 6.2% |
| 4th Grade | 83 | 8.5% |
| 5th Grade | 77 | 7.9% |
| 6th Grade | 97 | 9.9% |
| 7th Grade | 113 | 11.6% |
| 8th Grade | 110 | 11.3% |
| 9th Grade | 65 | 6.7% |
| 10th Grade | 80 | 8.2% |
| 11th Grade | 79 | 8.1% |
| 12th Grade | 35 | 3.6% |
Teacher Education Background (2009)
Percent With Ph.D.: 1.7%
Percent With Master's Degree: 22.7%
Percent With Bachelor's Degree: 6.7%
Teacher Credentials & Experience (2009)
Percent of Teachers With Credentials: 99.0%
Number of Certificated Staff: 119.0
Average Number of Years of Teacher Experience: 8.8
Average Age: 34.8
Source: CA Department of Education, Source: NCES 2009-2010
School Ratings and Reviews
Be The First To Review California Virtual Academy at Sonoma!
Sponsored Links
Test Scores and Performance Information
Overall School Rating
How is this determined?
The overall school rating shows that California Virtual Academy at Sonoma performed on average worse than many other schools across the state on CST state exams in the following subjects:
- CST Algebra I
- CST Algebra II
- CST Biology
- CST Chemistry
- CST Earth Science
- CST English-Language Arts
- CST General Mathematics
- CST Geometry
- CST History - Social Science
- CST Mathematics
- CST Science
- CST U.S. History
- CST World History
AYP Results (2010)
Overall AYP Met: No
ELA AYP Met: No
Math AYP Met: No
Program Improvement (PI) Requirement Under NCLB (2010)
First Year PI Requirement was Implemented: 2009-2010
School's Placement Under NCLB: Year 2
SAT Exam Results (2009)
Percent of Students Taking SAT Exam: 23.5%
CST - Test Proficiency by Grade and Subject
Grade 2 - % of students at or above proficiency
| School | District | State | |
|---|---|---|---|
| CST English-Language Arts Test | |||
| 2010 | 40.0% | 90.0% | 53.0% |
| 2009 | 33.0% | 75.0% | 53.0% |
| 2008 | 29.0% | 63.0% | 48.0% |
| CST Mathematics Test | |||
| 2010 | 35.0% | 83.0% | 62.0% |
| 2009 | 35.0% | 79.0% | 63.0% |
| 2008 | 29.0% | 60.0% | 59.0% |
Grade 3 - % of students at or above proficiency
| School | District | State | |
|---|---|---|---|
| CST English-Language Arts Test | |||
| 2010 | 44.0% | 63.0% | 43.0% |
| 2009 | 42.0% | 72.0% | 44.0% |
| 2008 | 40.0% | 82.0% | 38.0% |
| CST Mathematics Test | |||
| 2010 | 42.0% | 93.0% | 65.0% |
| 2009 | 28.0% | 96.0% | 64.0% |
| 2008 | 37.0% | 96.0% | 61.0% |
Grade 4 - % of students at or above proficiency
| School | District | State | |
|---|---|---|---|
| CST English-Language Arts Test | |||
| 2010 | 47.0% | 86.0% | 63.0% |
| 2009 | 57.0% | 89.0% | 61.0% |
| 2008 | 61.0% | 89.0% | 55.0% |
| CST Mathematics Test | |||
| 2010 | 25.0% | 73.0% | 68.0% |
| 2009 | 38.0% | 85.0% | 66.0% |
| 2008 | 33.0% | 89.0% | 61.0% |
Grade 5 - % of students at or above proficiency
| School | District | State | |
|---|---|---|---|
| CST English-Language Arts Test | |||
| 2010 | 53.0% | 92.0% | 58.0% |
| 2009 | 60.0% | 77.0% | 54.0% |
| 2008 | 48.0% | 81.0% | 48.0% |
| CST Mathematics Test | |||
| 2010 | 30.0% | 96.0% | 61.0% |
| 2009 | 37.0% | 96.0% | 57.0% |
| 2008 | 23.0% | 94.0% | 51.0% |
| CST Science Test | |||
| 2010 | 52.0% | 72.0% | 56.0% |
| 2009 | 55.0% | 65.0% | 49.0% |
| 2008 | 49.0% | 76.0% | 46.0% |
Grade 6 - % of students at or above proficiency
| School | District | State | |
|---|---|---|---|
| CST English-Language Arts Test | |||
| 2010 | 57.0% | 80.0% | 55.0% |
| 2009 | 57.0% | 67.0% | 52.0% |
| 2008 | 49.0% | 93.0% | 47.0% |
| CST Mathematics Test | |||
| 2010 | 28.0% | 88.0% | 52.0% |
| 2009 | 33.0% | 82.0% | 49.0% |
| 2008 | 33.0% | 80.0% | 44.0% |
Grade 7 - % of students at or above proficiency
| School | District | State | |
|---|---|---|---|
| CST English-Language Arts Test | |||
| 2010 | 54.0% | - | 55.0% |
| 2009 | 54.0% | - | 54.0% |
| 2008 | 51.0% | - | 49.0% |
| CST Mathematics Test | |||
| 2010 | 23.0% | - | 48.0% |
| 2009 | 29.0% | - | 43.0% |
| 2008 | 29.0% | - | 41.0% |
Grade 8 - % of students at or above proficiency
| School | District | State | |
|---|---|---|---|
| CST Algebra I Test | |||
| 2010 | 23.0% | - | 46.0% |
| 2009 | - | - | - |
| 2008 | 34.0% | - | 42.0% |
| CST English-Language Arts Test | |||
| 2010 | 61.0% | - | 54.0% |
| 2009 | 46.0% | - | 48.0% |
| 2008 | 43.0% | - | 45.0% |
| CST General Mathematics Test | |||
| 2010 | 24.0% | - | 30.0% |
| 2009 | 23.0% | - | 30.0% |
| 2008 | 14.0% | - | 31.0% |
| CST History - Social Science Test | |||
| 2010 | 47.0% | - | 47.0% |
| 2009 | 30.0% | - | 42.0% |
| 2008 | 20.0% | - | 36.0% |
| CST Science Test | |||
| 2010 | 37.0% | - | 59.0% |
| 2009 | 33.0% | - | 56.0% |
| 2008 | 26.0% | - | 52.0% |
Grade 9 - % of students at or above proficiency
| School | District | State | |
|---|---|---|---|
| CST Algebra I Test | |||
| 2010 | 21.0% | - | 22.0% |
| 2009 | 19.0% | - | 21.0% |
| 2008 | 6.0% | - | 18.0% |
| CST Biology Test | |||
| 2010 | 64.0% | - | 55.0% |
| CST Earth Science Test | |||
| 2010 | 30.0% | - | 35.0% |
| 2009 | 36.0% | - | 29.0% |
| CST English-Language Arts Test | |||
| 2010 | 62.0% | - | 54.0% |
| 2009 | 61.0% | - | 50.0% |
| 2008 | 36.0% | - | 49.0% |
| CST General Mathematics Test | |||
| 2010 | 24.0% | - | 17.0% |
| 2009 | 17.0% | - | 17.0% |
| 2008 | 16.0% | - | 18.0% |
| CST Geometry Test | |||
| 2009 | 6.0% | - | 47.0% |
| CST World History Test | |||
| 2008 | 18.0% | - | 36.0% |
Grade 10 - % of students at or above proficiency
| School | District | State | |
|---|---|---|---|
| CST Algebra I Test | |||
| 2010 | 7.0% | - | 12.0% |
| 2009 | 11.0% | - | 11.0% |
| CST Biology Test | |||
| 2010 | 34.0% | - | 38.0% |
| 2009 | 33.0% | - | 34.0% |
| 2008 | 23.0% | - | 35.0% |
| CST English-Language Arts Test | |||
| 2010 | 55.0% | - | 45.0% |
| 2009 | 53.0% | - | 44.0% |
| 2008 | 45.0% | - | 41.0% |
| CST Geometry Test | |||
| 2010 | 6.0% | - | 14.0% |
| 2009 | 18.0% | - | 14.0% |
| 2008 | 10.0% | - | 12.0% |
| CST Science Test | |||
| 2010 | 38.0% | - | 46.0% |
| 2009 | 48.0% | - | 44.0% |
| 2008 | 45.0% | - | 40.0% |
| CST World History Test | |||
| 2010 | 30.0% | - | 42.0% |
| 2009 | 34.0% | - | 38.0% |
| 2008 | 40.0% | - | 33.0% |
Grade 11 - % of students at or above proficiency
| School | District | State | |
|---|---|---|---|
| CST Chemistry Test | |||
| 2010 | 11.0% | - | 30.0% |
| CST English-Language Arts Test | |||
| 2010 | 48.0% | - | 42.0% |
| 2009 | 52.0% | - | 40.0% |
| 2008 | 44.0% | - | 37.0% |
| CST U.S. History Test | |||
| 2010 | 34.0% | - | 45.0% |
| 2009 | 44.0% | - | 44.0% |
| 2008 | 36.0% | - | 38.0% |
End of Course - % of students at or above proficiency
| School | District | State | |
|---|---|---|---|
| CST Algebra I Test | |||
| 2010 | 17.0% | - | 31.0% |
| 2009 | 13.0% | - | 28.0% |
| 2008 | 19.0% | - | 25.0% |
| CST Algebra II Test | |||
| 2010 | 7.0% | - | 31.0% |
| 2009 | 5.0% | - | 28.0% |
| CST Biology Test | |||
| 2010 | 39.0% | - | 46.0% |
| 2009 | 39.0% | - | 42.0% |
| 2008 | 20.0% | - | 42.0% |
| CST Chemistry Test | |||
| 2010 | 23.0% | - | 38.0% |
| 2009 | 31.0% | - | 36.0% |
| CST Earth Science Test | |||
| 2010 | 29.0% | - | 33.0% |
| 2009 | 43.0% | - | 28.0% |
| CST General Mathematics Test | |||
| 2010 | 24.0% | - | 27.0% |
| 2009 | 22.0% | - | 26.0% |
| 2008 | 15.0% | - | 27.0% |
| CST Geometry Test | |||
| 2010 | 4.0% | - | 27.0% |
| 2009 | 10.0% | - | 26.0% |
| 2008 | 11.0% | - | 24.0% |
| CST World History Test | |||
| 2010 | 32.0% | - | 41.0% |
| 2009 | 34.0% | - | 38.0% |
| 2008 | 29.0% | - | 33.0% |
Source: CA Department of Education 2009-2010
School Community Forum

Join a discussion about California Virtual Academy at Sonoma and talk to others in the community including students, parents, teachers, and administrators.
Popular Discussion Topics
- Admissions and Registration Questions (e.g. Dress Code and Discipline Policy)
- School Calendar and Upcoming Events (e.g. Graduation)
- After School Programs, Extracurricular Activities, and Athletics (e.g. Football)
- News and Announcements (e.g. Yearbook and Class Supply List Details)
- Graduate and Alumni Events (e.g. Organizing Class Reunions)
Navigation
Can't Find What You Are Looking For?
Rankings
Nearby Cities
Sponsored Links
K-12 Articles
Promoting Childhood Literacy
The number of American adults who are illiterate is astounding. People who lack the ability to read...
Middle School Homework and Study Habits
The report cards came home and you're disappointed with your child's scores. You know he has the...
Everyone Loves Going to the Doctor and Dentist
Going to the doctor or dentist can be traumatic for children of all ages. Many adults do not...
