Martin Luther King School
Rating
Not Available
Not Available

No Reviews Yet
Find Old Friends From Martin Luther King School
Use the form below to search for alumni from Martin Luther King School.
School Description
School Summary and Highlights
- Enrolls 756 elementary school students from grades KG-8
- Ranks 1943rd out of 2,050 middle schools in CA.
- 2010 Overall School AYP Met Status: No
School Operational Details
- Title I EligibleAll students of this school are eligible for participation in authorized programs.
School District Details
- Monterey Peninsula Unified School District
- Per-Pupil Spending: $8,701
- Graduation Rate: 59.2%
- Dropout Rate: 2.4%
- Students Per Teacher: 23.8
- Enrolled Students: 11,624
Faculty Details and Student Enrollment
Students and Faculty
- Total Students Enrolled: 756
- Total Full Time "Equivalent" Teachers: 30.0
- Average Student-To-Teacher Ratio: 25.2
Students Gender Breakdown
- Males: 396 (52.4%)
- Females: 360 (47.6%)
Free Lunch Student Eligibility Breakdown
- Eligible for Reduced Lunch: 116 (15.3%)
- Eligible for Free Lunch: 525 (69.4%)
- Eligible for Either Reduced or Free Lunch: 641 (84.8%)
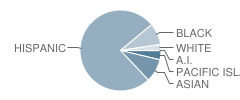
Student Enrollment Distribution by Race / Ethnicity
| Number | Percent | |
|---|---|---|
| American Indian | 1 | 0.1% |
| Black | 64 | 8.5% |
| Asian | 69 | 9.1% |
| Hispanic | 563 | 74.5% |
| White | 18 | 2.4% |
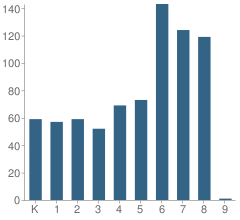
Number of Students Per Grade
| Number | Percent | |
|---|---|---|
| Kindergarten | 59 | 7.8% |
| 1st Grade | 57 | 7.5% |
| 2nd Grade | 59 | 7.8% |
| 3rd Grade | 52 | 6.9% |
| 4th Grade | 69 | 9.1% |
| 5th Grade | 73 | 9.7% |
| 6th Grade | 143 | 18.9% |
| 7th Grade | 124 | 16.4% |
| 8th Grade | 119 | 15.7% |
| 9th Grade | 1 | 0.1% |
Teacher Education Background (2009)
Percent With Ph.D.
School:
2.3%
District:
4.3%
Percent With Master's Degree
School:
16.3%
District:
13.0%
Percent With Bachelor's Degree
School:
14.0%
District:
23.9%
Teacher Credentials & Experience (2009)
Percent of Teachers With Emergency Credentials: 2.5%
Percent of Teachers With Credentials: 100.0%
Number of Certificated Staff: 43.0
Average Number of Years of Teacher Experience: 5.0
Average Age
School:
42.1
District:
44.6
Source: CA Department of Education, Source: NCES 2009-2010
School Ratings and Reviews
Be The First To Review Martin Luther King School!
School Map and Similar Schools Nearby
Click to Activate Map of Nearby School Campuses
Private
Public
This School
Similar Schools Nearby
| Highland Elementary School KG-5 | 453 Students | 0.2 miles away | Not Yet Rated | |
| Ord Terrace Elementary School KG-5 | 595 Students | 0.5 miles away |  5 out of 5 | |
| Del Rey Woods Elementary School KG-5 | 490 Students | 1.0 miles away | Not Yet Rated | |
| George C. Marshall Elementary School KG-5 | 768 Students | 2.3 miles away | 5 out of 5 | |
| Foothill Elementary School KG-6 | 495 Students | 2.7 miles away | Not Yet Rated | |
| La Mesa Elementary School KG-6 | 547 Students | 3.5 miles away | 5 out of 5 | |
| Bay View Elementary School KG-6 | 331 Students | 4.3 miles away | Not Yet Rated | |
| Walter Colton School KG-8 | 806 Students | 4.9 miles away | Not Yet Rated | |
| Robert Down Elementary School KG-6 | 432 Students | 5.0 miles away | Not Yet Rated | |
| J. C. Crumpton Elementary School KG-5 | 473 Students | 5.1 miles away | Not Yet Rated | |
Compare This School To Nearby Schools ->
School Community Forum

Join a discussion about Martin Luther King School and talk to others in the community including students, parents, teachers, and administrators.
Popular Discussion Topics
- Admissions and Registration Questions (e.g. Dress Code and Discipline Policy)
- School Calendar and Upcoming Events (e.g. Graduation)
- After School Programs, Extracurricular Activities, and Athletics (e.g. Football)
- News and Announcements (e.g. Yearbook and Class Supply List Details)
- Graduate and Alumni Events (e.g. Organizing Class Reunions)
Navigation
Can't Find What You Are Looking For?
Rankings
Nearby Cities
Sponsored Links
K-12 Articles

Those Pesky Little Transitions
Transitions are rarely easy, yet we have to encounter them every day of our lives. For school-aged...
Transitions are rarely easy, yet we have to encounter them every day of our lives. For school-aged...

Keep Morning Stress at a Minimum: Establish a Routine
Morning! It can be a time of stress. The kids are fighting over who gets to use the bathroom first,...
Morning! It can be a time of stress. The kids are fighting over who gets to use the bathroom first,...

Feeling Good in Your Own Skin
Body image is a very touchy issue with today's kids. Since the 1950s, when Barbie was first...
Body image is a very touchy issue with today's kids. Since the 1950s, when Barbie was first...