Badger Springs Middle School
24750 Delphinium Ave, Moreno Valley, CA 92553 | (951) 571-4200
- Grades: 6-8
- Student Enrollment: 1,357
Rating
Not Available
Not Available

4 out of 5 | 1 Review
Find Old Friends From Badger Springs Middle School
Use the form below to search for alumni from Badger Springs Middle School.
School Description
School Summary and Highlights
- Enrolls 1,357 middle school students from grades 6-8
- Ranks 1976th out of 2,050 middle schools in CA.
- 2010 Overall School AYP Met Status: No
Additional Contact Information
- Mailing Address: 24750 Delphinium Ave., Moreno Valley, CA 92553
School Operational Details
- Title I EligibleAll students of this school are eligible for participation in authorized programs.
School District Details
- Moreno Valley Unified School District
- Per-Pupil Spending: $8,394
- Graduation Rate: 60.5%
- Dropout Rate: 7.0%
- Students Per Teacher: 24.5
- Enrolled Students: 36,663
Faculty Details and Student Enrollment
Students and Faculty
- Total Students Enrolled: 1,357
- Total Full Time "Equivalent" Teachers: 64.4
- Average Student-To-Teacher Ratio: 21.1
Students Gender Breakdown
- Males: 687 (50.6%)
- Females: 670 (49.4%)
Free Lunch Student Eligibility Breakdown
- Eligible for Reduced Lunch: 187 (13.8%)
- Eligible for Free Lunch: 960 (70.7%)
- Eligible for Either Reduced or Free Lunch: 1,147 (84.5%)
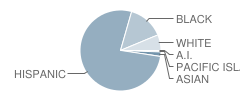
Student Enrollment Distribution by Race / Ethnicity
| Number | Percent | |
|---|---|---|
| American Indian | 6 | 0.4% |
| Black | 192 | 14.1% |
| Asian | 25 | 1.8% |
| Hispanic | 1,031 | 76.0% |
| White | 85 | 6.3% |
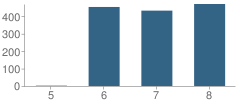
Number of Students Per Grade
| Number | Percent | |
|---|---|---|
| 5th Grade | 2 | 0.1% |
| 6th Grade | 453 | 33.4% |
| 7th Grade | 432 | 31.8% |
| 8th Grade | 470 | 34.6% |
Teacher Education Background (2009)
Percent With Master's Degree
School:
26.4%
District:
35.4%
Percent With Bachelor's Degree
School:
8.3%
District:
3.8%
Teacher Credentials & Experience (2009)
Percent of Teachers With Emergency Credentials: 1.5%
Percent of Teachers With Credentials: 80.0%
Number of Certificated Staff: 72.0
Average Number of Years of Teacher Experience: 10.0
Average Age
School:
38.5
District:
49.0
Source: CA Department of Education, Source: NCES 2009-2010
School Ratings and Reviews
Overall Rating: 4

4 out of 5 | 1 Review
The Overall Rating is the school's average rating from parents, students, school faculty and staff. The highest rating is five apples and the lowest is one apple.
Share Your Review About This School
1 review for Badger Springs Middle School
- Reviewed by Student on January 30, 2007
- Rating:
 (4 / 5) Flag as inappropriate
 - badger springs is the bom my school is the stuff....
School Map and Similar Schools Nearby
Click to Activate Map of Nearby School Campuses
Private
Public
This School
Similar Schools Nearby
| March Middle School 6-8 | 820 Students | 1.1 miles away |  3 out of 5 | |
| Sunnymead Middle School 6-8 | 1,636 Students | 1.9 miles away | Not Yet Rated | |
| Vista Verde Middle School 6-8 | 1,070 Students | 2.1 miles away | Not Yet Rated | |
| Mountain View Middle School 6-8 | 1,343 Students | 2.4 miles away | 3 out of 5 | |
| Landmark Middle School 6-8 | 1,356 Students | 3.0 miles away |  4 out of 5 | |
| Palm Middle School 6-8 | 1,219 Students | 3.0 miles away |  4.5 out of 5 | |
| Tomas Rivera Elementary School KG-6 | 767 Students | 4.5 miles away |  5 out of 5 | |
| Vista Heights Middle School 6-8 | 1,468 Students | 4.6 miles away | 5 out of 5 | |
| Hidden Springs Elementary School KG-6 | 539 Students | 4.6 miles away | 5 out of 5 | |
| Amelia Earhart Middle School 7-8 | 1,197 Students | 4.6 miles away | Not Yet Rated | |
Compare This School To Nearby Schools ->
School Community Forum

Join a discussion about Badger Springs Middle School and talk to others in the community including students, parents, teachers, and administrators.
Popular Discussion Topics
- Admissions and Registration Questions (e.g. Dress Code and Discipline Policy)
- School Calendar and Upcoming Events (e.g. Graduation)
- After School Programs, Extracurricular Activities, and Athletics (e.g. Football)
- News and Announcements (e.g. Yearbook and Class Supply List Details)
- Graduate and Alumni Events (e.g. Organizing Class Reunions)
Navigation
Can't Find What You Are Looking For?
Rankings
Nearby Cities
Sponsored Links
K-12 Articles

School Violence: Can It Be Stopped
It’s a fact that violence in schools is prevalent in today’s society. We hear of school shootings,...
It’s a fact that violence in schools is prevalent in today’s society. We hear of school shootings,...

Teaching Children with Learning Disabilities to Make Friends
Children with learning disabilities often have trouble making and retaining friendships. Some kids...
Children with learning disabilities often have trouble making and retaining friendships. Some kids...

Tips for Purchasing Back to School Supplies
In just a few days, kids from all over the US will be going back to school. Now is the time to take...
In just a few days, kids from all over the US will be going back to school. Now is the time to take...