Mountain Empire High School
3305 Buckman Springs Rd, Pine Valley, CA 91962 | (619) 473-8601
- Grades: 9-12
- Student Enrollment: 449
Rating
Not Available
Not Available

5 out of 5 | 1 Review
Find Old Friends From Mountain Empire High School
Use the form below to search for alumni from Mountain Empire High School.
School Description
School Summary and Highlights
- Enrolls 449 high school students from grades 9-12
- Ranks 1050th out of 1,197 high schools in CA.
- 2010 Overall School AYP Met Status: No
Additional Contact Information
- Mailing Address: 3305 Buckman Springs Rd., Pine Valley, CA 91962
School Operational Details
- Title I EligibleAll students of this school are eligible for participation in authorized programs.
School District Details
- Mountain Empire Unified School District
- Per-Pupil Spending: $10,089
- Graduation Rate: 60.1%
- Dropout Rate: 5.6%
- Students Per Teacher: 18.7
- Enrolled Students: 2,399
Faculty Details and Student Enrollment
Students and Faculty
- Total Students Enrolled: 449
- Total Full Time "Equivalent" Teachers: 22.3
- Average Student-To-Teacher Ratio: 20.1
Students Gender Breakdown
- Males: 246 (54.8%)
- Females: 203 (45.2%)
Free Lunch Student Eligibility Breakdown
- Eligible for Reduced Lunch: 61 (13.6%)
- Eligible for Free Lunch: 238 (53.0%)
- Eligible for Either Reduced or Free Lunch: 299 (66.6%)
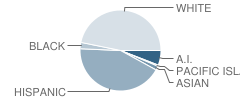
Student Enrollment Distribution by Race / Ethnicity
| Number | Percent | |
|---|---|---|
| American Indian | 27 | 6.0% |
| Black | 12 | 2.7% |
| Asian | 8 | 1.8% |
| Hispanic | 190 | 42.3% |
| White | 208 | 46.3% |
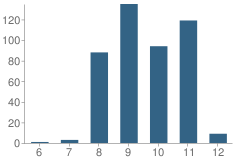
Number of Students Per Grade
| Number | Percent | |
|---|---|---|
| 6th Grade | 1 | 0.2% |
| 7th Grade | 3 | 0.7% |
| 8th Grade | 88 | 19.6% |
| 9th Grade | 135 | 30.1% |
| 10th Grade | 94 | 20.9% |
| 11th Grade | 119 | 26.5% |
| 12th Grade | 9 | 2.0% |
Graduates Information (2010)
Graduation Rate
School:
94.0%
District:
75.4%
State:
78.6%
Teacher Education Background (2009)
Percent With Ph.D.: 3.8%
Percent With Master's Degree
School:
42.3%
District:
50.0%
Percent With Bachelor's Degree
School:
3.8%
District:
33.3%
Teacher Credentials & Experience (2009)
Percent of Teachers With Credentials: 100.0%
Number of Certificated Staff: 26.0
Average Number of Years of Teacher Experience: 14.6
Average Age
School:
47.8
District:
41.7
Source: CA Department of Education, Source: NCES 2009-2010
School Ratings and Reviews
Overall Rating: 5

5 out of 5 | 1 Review
The Overall Rating is the school's average rating from parents, students, school faculty and staff. The highest rating is five apples and the lowest is one apple.
Share Your Review About This School
1 review for Mountain Empire High School
- Reviewed by Parent/Guardian on November 05, 2008
- Rating:
 (5 / 5) Flag as inappropriate
 - my daughter has been at 2 big city high schools due to moving, and this school is THE best. more one on one attention, and she's thriving. the teachers have the time to pay attention to all of the students.
School Map and Similar Schools Nearby
Click to Activate Map of Nearby School Campuses
Private
Public
This School
Similar Schools Nearby
| Monte Vista High School 9-12 | 2,096 Students | 28.0 miles away | Not Yet Rated | |
| Eastlake High School 9-12 | 2,467 Students | 28.2 miles away | Not Yet Rated | |
| Olympian High School 9-12 | 1,565 Students | 29.2 miles away | Not Yet Rated | |
Compare This School To Nearby Schools ->
School Community Forum

Join a discussion about Mountain Empire High School and talk to others in the community including students, parents, teachers, and administrators.
Popular Discussion Topics
- Admissions and Registration Questions (e.g. Dress Code and Discipline Policy)
- School Calendar and Upcoming Events (e.g. Graduation)
- After School Programs, Extracurricular Activities, and Athletics (e.g. Football)
- News and Announcements (e.g. Yearbook and Class Supply List Details)
- Graduate and Alumni Events (e.g. Organizing Class Reunions)
Navigation
Can't Find What You Are Looking For?
Rankings
Nearby Cities
Sponsored Links
K-12 Articles

Teaching Kids to Deal with Peer Pressure
Parents usually become very concerned when they hear the term "peer pressure." However, peer...
Parents usually become very concerned when they hear the term "peer pressure." However, peer...

Strategies to Help Kids Cope with Stress
Many parents believe that kids don't experience stress. Nothing could be further from the truth....
Many parents believe that kids don't experience stress. Nothing could be further from the truth....

Exciting School Lunch Ideas
Earlier this week I had reason to drop by my grandsons' school at lunch time. While waiting for the...
Earlier this week I had reason to drop by my grandsons' school at lunch time. While waiting for the...