Pacific Coast Charter School
Rating
Not Available
Not Available

No Reviews Yet
Find Old Friends From Pacific Coast Charter School
Use the form below to search for alumni from Pacific Coast Charter School.
School Description
School Summary and Highlights
- Enrolls 261 elementary, middle, and high school students from grades KG-12
- Ranks 971st out of 1,197 high schools in CA.
- 2010 Overall School AYP Met Status: No
Additional Contact Information
- Mailing Address: 294 Green Valley Rd., Watsonville, CA 95076
School Operational Details
- Charter School
School District Details
- Pajaro Valley Unified School District
- Per-Pupil Spending: $10,711
- Graduation Rate: 71.0%
- Dropout Rate: 3.3%
- Students Per Teacher: 23.5
- Enrolled Students: 19,381
Faculty Details and Student Enrollment
Students and Faculty
- Total Students Enrolled: 261
- Total Full Time "Equivalent" Teachers: 11.0
- Average Student-To-Teacher Ratio: 23.7
Students Gender Breakdown
- Males: 108 (41.4%)
- Females: 153 (58.6%)
Free Lunch Student Eligibility Breakdown
- Eligible for Reduced Lunch: 6 (2.3%)
- Eligible for Free Lunch: 58 (22.2%)
- Eligible for Either Reduced or Free Lunch: 64 (24.5%)
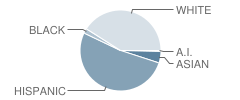
Student Enrollment Distribution by Race / Ethnicity
| Number | Percent | |
|---|---|---|
| American Indian | 1 | 0.4% |
| Black | 5 | 1.9% |
| Asian | 12 | 4.6% |
| Hispanic | 136 | 52.1% |
| White | 107 | 41.0% |
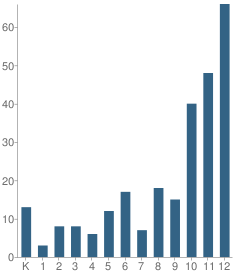
Number of Students Per Grade
| Number | Percent | |
|---|---|---|
| Kindergarten | 13 | 5.0% |
| 1st Grade | 3 | 1.1% |
| 2nd Grade | 8 | 3.1% |
| 3rd Grade | 8 | 3.1% |
| 4th Grade | 6 | 2.3% |
| 5th Grade | 12 | 4.6% |
| 6th Grade | 17 | 6.5% |
| 7th Grade | 7 | 2.7% |
| 8th Grade | 18 | 6.9% |
| 9th Grade | 15 | 5.7% |
| 10th Grade | 40 | 15.3% |
| 11th Grade | 48 | 18.4% |
| 12th Grade | 66 | 25.3% |
Graduates Information (2010)
Graduation Rate
School:
77.0%
District:
81.1%
State:
78.6%
Teacher Education Background (2009)
Percent With Master's Degree
School:
23.1%
District:
25.0%
Percent With Bachelor's Degree
School:
15.4%
District:
6.8%
Teacher Credentials & Experience (2009)
Percent of Teachers With Credentials: 92.3%
Number of Certificated Staff: 13.0
Average Number of Years of Teacher Experience: 21.5
Average Age
School:
51.7
District:
51.1
Source: CA Department of Education, Source: NCES 2009-2010
School Ratings and Reviews
Be The First To Review Pacific Coast Charter School!
School Map and Similar Schools Nearby
Click to Activate Map of Nearby School Campuses
Private
Public
This School
Similar Schools Nearby
| Cypress Charter High School 9-12 | 134 Students | 12.0 miles away | Not Yet Rated | |
| Delta Charter School 9-12 | 116 Students | 14.1 miles away | Not Yet Rated | |
| Pacific Collegiate Charter School 7-12 | 475 Students | 15.5 miles away | Not Yet Rated | |
| Slvusd Charter School KG-12 | 327 Students | 19.4 miles away | Not Yet Rated | |
Compare This School To Nearby Schools ->
School Community Forum

Join a discussion about Pacific Coast Charter School and talk to others in the community including students, parents, teachers, and administrators.
Popular Discussion Topics
- Admissions and Registration Questions (e.g. Dress Code and Discipline Policy)
- School Calendar and Upcoming Events (e.g. Graduation)
- After School Programs, Extracurricular Activities, and Athletics (e.g. Football)
- News and Announcements (e.g. Yearbook and Class Supply List Details)
- Graduate and Alumni Events (e.g. Organizing Class Reunions)
Navigation
Can't Find What You Are Looking For?
Rankings
Nearby Cities
Sponsored Links
K-12 Articles

Keep Morning Stress at a Minimum: Establish a Routine
Morning! It can be a time of stress. The kids are fighting over who gets to use the bathroom first,...
Morning! It can be a time of stress. The kids are fighting over who gets to use the bathroom first,...

Hurt: A Book Report
My last book report was over 15 years ago, and I'm a bit rusty, but here goes (Don't forget: book...
My last book report was over 15 years ago, and I'm a bit rusty, but here goes (Don't forget: book...

Summer Advice
A few weeks ago, at the weekly after-school program I run through my local church, a group of...
A few weeks ago, at the weekly after-school program I run through my local church, a group of...