Willow Oaks Elementary School
Rating
Not Available
Not Available

5 out of 5 | 1 Review
Find Old Friends From Willow Oaks Elementary School
Use the form below to search for alumni from Willow Oaks Elementary School.
School Description
School Summary and Highlights
- Enrolls 564 elementary school students from grades KG-8
- Ranks 1709th out of 2,050 middle schools in CA.
- 2010 Overall School AYP Met Status: Yes
Additional Contact Information
- Mailing Address: 620 Willow Rd., Menlo Park, CA 94025
School Operational Details
- Title I EligibleAll students of this school are eligible for participation in authorized programs.
School District Details
- Ravenswood City Elementary School District
- Per-Pupil Spending: $8,181
- Dropout Rate: 3.0%
- Students Per Teacher: 16.9
- Enrolled Students: 4,381
Faculty Details and Student Enrollment
Students and Faculty
- Total Students Enrolled: 564
- Total Full Time "Equivalent" Teachers: 30.0
- Average Student-To-Teacher Ratio: 18.8
Students Gender Breakdown
- Males: 294 (52.1%)
- Females: 270 (47.9%)
Free Lunch Student Eligibility Breakdown
- Eligible for Reduced Lunch: 41 (7.3%)
- Eligible for Free Lunch: 472 (83.7%)
- Eligible for Either Reduced or Free Lunch: 513 (91.0%)
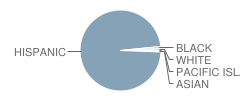
Student Enrollment Distribution by Race / Ethnicity
| Number | Percent | |
|---|---|---|
| American Indian | - | - |
| Black | 4 | 0.7% |
| Asian | 1 | 0.2% |
| Hispanic | 486 | 86.2% |
| White | 4 | 0.7% |
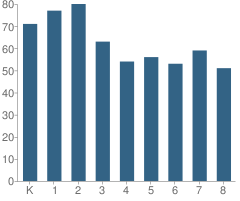
Number of Students Per Grade
| Number | Percent | |
|---|---|---|
| Kindergarten | 71 | 12.6% |
| 1st Grade | 77 | 13.7% |
| 2nd Grade | 80 | 14.2% |
| 3rd Grade | 63 | 11.2% |
| 4th Grade | 54 | 9.6% |
| 5th Grade | 56 | 9.9% |
| 6th Grade | 53 | 9.4% |
| 7th Grade | 59 | 10.5% |
| 8th Grade | 51 | 9.0% |
Teacher Education Background (2009)
Percent With Master's Degree
School:
21.9%
District:
42.5%
Percent With Bachelor's Degree
School:
18.8%
District:
7.5%
Teacher Credentials & Experience (2009)
Percent of Teachers With Credentials: 93.1%
Number of Certificated Staff: 32.0
Average Number of Years of Teacher Experience: 10.2
Average Age
School:
38.8
District:
44.3
Source: CA Department of Education, Source: NCES 2009-2010
School Ratings and Reviews
Overall Rating: 5

5 out of 5 | 1 Review
The Overall Rating is the school's average rating from parents, students, school faculty and staff. The highest rating is five apples and the lowest is one apple.
Share Your Review About This School
1 review for Willow Oaks Elementary School
- Reviewed by Student on July 10, 2007
- Rating:
 (5 / 5) Flag as inappropriate
 - This school is the best there is the best there was and the best that will ever be!
School Map and Similar Schools Nearby
Click to Activate Map of Nearby School Campuses
Private
Public
This School
Similar Schools Nearby
| Laurel Elementary School KG-2 | 395 Students | 0.8 miles away | Not Yet Rated | |
| Belle Haven Elementary School KG-8 | 554 Students | 1.0 miles away | Not Yet Rated | |
| Cesar Chavez Elementary School 6-8 | 317 Students | 1.1 miles away | Not Yet Rated | |
| Addison Elementary School KG-5 | 443 Students | 1.2 miles away | Not Yet Rated | |
| James Flood Magnet Elementary School KG-8 | 275 Students | 1.3 miles away | Not Yet Rated | |
| Edison-Brentwood Elementary School 6-8 | 210 Students | 1.5 miles away | Not Yet Rated | |
| Costano Elementary School KG-8 | 376 Students | 1.5 miles away | Not Yet Rated | |
| Walter Hays Elementary School KG-5 | 529 Students | 1.5 miles away | Not Yet Rated | |
| Duveneck Elementary School KG-5 | 485 Students | 1.6 miles away | Not Yet Rated | |
| Encinal Elementary School KG-5 | 705 Students | 1.6 miles away | Not Yet Rated | |
Compare This School To Nearby Schools ->
School Community Forum

Join a discussion about Willow Oaks Elementary School and talk to others in the community including students, parents, teachers, and administrators.
Popular Discussion Topics
- Admissions and Registration Questions (e.g. Dress Code and Discipline Policy)
- School Calendar and Upcoming Events (e.g. Graduation)
- After School Programs, Extracurricular Activities, and Athletics (e.g. Football)
- News and Announcements (e.g. Yearbook and Class Supply List Details)
- Graduate and Alumni Events (e.g. Organizing Class Reunions)
Navigation
Can't Find What You Are Looking For?
Rankings
Nearby Cities
Sponsored Links
K-12 Articles

When Bad Report Cards Happen to Good Kids
It’s mid-term season once again, and semester (or quarter or trimester) grades will be coming out...
It’s mid-term season once again, and semester (or quarter or trimester) grades will be coming out...

Just a Harmless Vanilla Bean?
Some of the greatest, most used, and most profitable breakthroughs in science have not been made by...
Some of the greatest, most used, and most profitable breakthroughs in science have not been made by...

Help Your Child Achieve Success in Middle School
Middle school is for children between the ages of 10 and 14 years. At this time children begin to...
Middle school is for children between the ages of 10 and 14 years. At this time children begin to...