Castle View Elementary School
Rating
Not Available
Not Available

3 out of 5 | 1 Review
Find Old Friends From Castle View Elementary School
Use the form below to search for alumni from Castle View Elementary School.
School Description
School Summary and Highlights
- Enrolls 562 elementary school students from grades KG-6
- Ranks 2490th out of 5,423 elementary schools in CA.
- 2010 Overall School AYP Met Status: No
Additional Contact Information
- Mailing Address: 6201 Shaker Dr., Riverside, CA 92506
School District Details
- Riverside Unified School District
- Per-Pupil Spending: $8,268
- Graduation Rate: 66.6%
- Dropout Rate: 3.4%
- Students Per Teacher: 23.2
- Enrolled Students: 42,501
Faculty Details and Student Enrollment
Students and Faculty
- Total Students Enrolled: 562
- Total Full Time "Equivalent" Teachers: 25.2
- Average Student-To-Teacher Ratio: 22.3
Students Gender Breakdown
- Males: 296 (52.7%)
- Females: 266 (47.3%)
Free Lunch Student Eligibility Breakdown
- Eligible for Reduced Lunch: 47 (8.4%)
- Eligible for Free Lunch: 269 (47.9%)
- Eligible for Either Reduced or Free Lunch: 316 (56.2%)
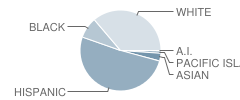
Student Enrollment Distribution by Race / Ethnicity
| Number | Percent | |
|---|---|---|
| American Indian | 2 | 0.4% |
| Black | 45 | 8.0% |
| Asian | 17 | 3.0% |
| Hispanic | 271 | 48.2% |
| White | 192 | 34.2% |
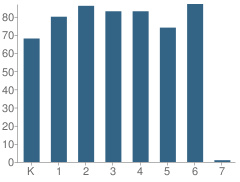
Number of Students Per Grade
| Number | Percent | |
|---|---|---|
| Kindergarten | 68 | 12.1% |
| 1st Grade | 80 | 14.2% |
| 2nd Grade | 86 | 15.3% |
| 3rd Grade | 83 | 14.8% |
| 4th Grade | 83 | 14.8% |
| 5th Grade | 74 | 13.2% |
| 6th Grade | 87 | 15.5% |
| 7th Grade | 1 | 0.2% |
Teacher Education Background (2009)
Percent With Master's Degree
School:
32.1%
District:
39.8%
Percent With Bachelor's Degree
School:
53.6%
District:
23.7%
Teacher Credentials & Experience (2009)
Percent of Teachers With Credentials: 100.0%
Number of Certificated Staff: 28.0
Average Number of Years of Teacher Experience: 12.6
Average Age
School:
44.0
District:
48.2
Source: CA Department of Education, Source: NCES 2009-2010
School Ratings and Reviews
Overall Rating: 3

3 out of 5 | 1 Review
The Overall Rating is the school's average rating from parents, students, school faculty and staff. The highest rating is five apples and the lowest is one apple.
Share Your Review About This School
1 review for Castle View Elementary School
- Reviewed by Parent/Guardian on February 12, 2009
- Rating:
 (3 / 5) Flag as inappropriate
 - site is clean at all times.
School Map and Similar Schools Nearby
Click to Activate Map of Nearby School Campuses
Private
Public
This School
Similar Schools Nearby
| William Howard Taft Elementary School KG-6 | 746 Students | 0.9 miles away |  5 out of 5 | |
| Alcott Elementary School KG-6 | 849 Students | 1.7 miles away | Not Yet Rated | |
| Victoria Elementary School KG-6 | 590 Students | 1.9 miles away | 5 out of 5 | |
| Emerson Elementary School KG-6 | 744 Students | 2.0 miles away | Not Yet Rated | |
| Washington Elementary School KG-6 | 713 Students | 2.3 miles away | 5 out of 5 | |
| Hyatt Elementary School KG-6 | 335 Students | 2.7 miles away | 5 out of 5 | |
| John F. Kennedy Elementary School KG-6 | 1,000 Students | 2.9 miles away | Not Yet Rated | |
| Pachappa Elementary School KG-6 | 695 Students | 2.9 miles away | Not Yet Rated | |
| Seneca Elementary School KG-5 | 644 Students | 2.9 miles away |  4.5 out of 5 | |
| Longfellow Elementary School KG-6 | 764 Students | 3.0 miles away | Not Yet Rated | |
Compare This School To Nearby Schools ->
School Community Forum

Join a discussion about Castle View Elementary School and talk to others in the community including students, parents, teachers, and administrators.
Popular Discussion Topics
- Admissions and Registration Questions (e.g. Dress Code and Discipline Policy)
- School Calendar and Upcoming Events (e.g. Graduation)
- After School Programs, Extracurricular Activities, and Athletics (e.g. Football)
- News and Announcements (e.g. Yearbook and Class Supply List Details)
- Graduate and Alumni Events (e.g. Organizing Class Reunions)
Navigation
Can't Find What You Are Looking For?
Rankings
Nearby Cities
Sponsored Links
K-12 Articles

Choosing a Summer Camp for Your Child
Are you planning to send your child to summer camp this year? If so, have you taken his needs into...
Are you planning to send your child to summer camp this year? If so, have you taken his needs into...

Bullies... What Are They Good For?
Bullies have been around since the beginning of time. We had to deal with bullies, and our parents...
Bullies have been around since the beginning of time. We had to deal with bullies, and our parents...

Teaching Children a Love of History
Parents and grandparents are responsible for teaching children a love of history. To begin, relate...
Parents and grandparents are responsible for teaching children a love of history. To begin, relate...