Santa Barbara Junior High School
Rating
Not Available
Not Available

No Reviews Yet
Find Old Friends From Santa Barbara Junior High School
Use the form below to search for alumni from Santa Barbara Junior High School.
School Description
School Summary and Highlights
- Enrolls 732 middle and high school students from grades 7-8
- Ranks 674th out of 2,050 middle schools in CA.
- 2010 Overall School AYP Met Status: Yes
Additional Contact Information
- Mailing Address: 721 East Cota St., Santa Barbara, CA 93103
School Operational Details
- Title I EligibleAll students of this school are eligible for participation in authorized programs.
Faculty Details and Student Enrollment
Students and Faculty
- Total Students Enrolled: 732
- Total Full Time "Equivalent" Teachers: 34.4
- Average Student-To-Teacher Ratio: 21.3
Students Gender Breakdown
- Males: 375 (51.2%)
- Females: 357 (48.8%)
Free Lunch Student Eligibility Breakdown
- Eligible for Reduced Lunch: 78 (10.7%)
- Eligible for Free Lunch: 286 (39.1%)
- Eligible for Either Reduced or Free Lunch: 364 (49.7%)
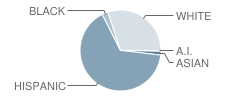
Student Enrollment Distribution by Race / Ethnicity
| Number | Percent | |
|---|---|---|
| American Indian | 2 | 0.3% |
| Black | 17 | 2.3% |
| Asian | 11 | 1.5% |
| Hispanic | 466 | 63.7% |
| White | 213 | 29.1% |
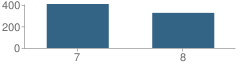
Number of Students Per Grade
| Number | Percent | |
|---|---|---|
| 7th Grade | 407 | 55.6% |
| 8th Grade | 325 | 44.4% |
Teacher Education Background (2009)
Percent With Master's Degree
School:
7.0%
District:
11.1%
Percent With Bachelor's Degree
School:
9.3%
District:
11.1%
Teacher Credentials & Experience (2009)
Percent of Teachers With Credentials: 100.0%
Number of Certificated Staff: 43.0
Average Number of Years of Teacher Experience: 17.1
Average Age
School:
44.2
District:
47.5
Source: CA Department of Education, Source: NCES 2009-2010
School Ratings and Reviews
Be The First To Review Santa Barbara Junior High School!
School Map and Similar Schools Nearby
Click to Activate Map of Nearby School Campuses
Private
Public
This School
Similar Schools Nearby
| Santa Barbara High School 9-12 | 2,285 Students | 0.5 miles away | Not Yet Rated | |
| La Cumbre Junior High School 7-8 | 468 Students | 2.2 miles away | Not Yet Rated | |
| La Colina Junior High School 7-8 | 959 Students | 4.1 miles away |  5 out of 5 | |
| San Marcos High School 9-12 | 1,828 Students | 5.6 miles away | Not Yet Rated | |
| Goleta Valley Junior High School 7-8 | 856 Students | 8.5 miles away | Not Yet Rated | |
| Carpinteria High School 9-12 | 721 Students | 9.9 miles away | Not Yet Rated | |
| Dos Pueblos High School 9-12 | 2,389 Students | 10.9 miles away | Not Yet Rated | |
| Nordhoff High School 9-12 | 952 Students | 24.2 miles away | 5 out of 5 | |
| Matilija Junior High School 7-8 | 518 Students | 24.7 miles away | Not Yet Rated | |
| Ventura High School 9-12 | 2,105 Students | 26.1 miles away | Not Yet Rated | |
Compare This School To Nearby Schools ->
School Community Forum

Join a discussion about Santa Barbara Junior High School and talk to others in the community including students, parents, teachers, and administrators.
Popular Discussion Topics
- Admissions and Registration Questions (e.g. Dress Code and Discipline Policy)
- School Calendar and Upcoming Events (e.g. Graduation)
- After School Programs, Extracurricular Activities, and Athletics (e.g. Football)
- News and Announcements (e.g. Yearbook and Class Supply List Details)
- Graduate and Alumni Events (e.g. Organizing Class Reunions)
Navigation
Can't Find What You Are Looking For?
Rankings
Nearby Cities
Sponsored Links
K-12 Articles

Teacher Tenure: A Double-Edged Sword
Teacher Tenure (the policy making it almost impossible to fire teachers) has noble roots. It was...
Teacher Tenure (the policy making it almost impossible to fire teachers) has noble roots. It was...

Teaching Your Child Study Skills
Many children who have the capability to get good grades experience frustration because of low...
Many children who have the capability to get good grades experience frustration because of low...

Kids and Competition
In the backyard, the classroom, the community and while participating in sports and other...
In the backyard, the classroom, the community and while participating in sports and other...