Marian A. Peterson Middle School
Rating
Not Available
Not Available

No Reviews Yet
Find Old Friends From Marian A. Peterson Middle School
Use the form below to search for alumni from Marian A. Peterson Middle School.
School Description
School Summary and Highlights
- Enrolls 936 middle school students from grades 6-8
- Ranks 394th out of 2,050 middle schools in CA.
- 2010 Overall School AYP Met Status: No
Additional Contact Information
- Mailing Address: 1380 Rosalia Ave., Sunnyvale, CA 94087
School District Details
- Santa Clara Unified School District
- Per-Pupil Spending: $9,564
- Graduation Rate: 81.6%
- Dropout Rate: 2.9%
- Students Per Teacher: 21.0
- Enrolled Students: 14,927
Faculty Details and Student Enrollment
Students and Faculty
- Total Students Enrolled: 936
- Total Full Time "Equivalent" Teachers: 36.8
- Average Student-To-Teacher Ratio: 25.4
Students Gender Breakdown
- Males: 494 (52.8%)
- Females: 442 (47.2%)
Free Lunch Student Eligibility Breakdown
- Eligible for Reduced Lunch: 76 (8.1%)
- Eligible for Free Lunch: 194 (20.7%)
- Eligible for Either Reduced or Free Lunch: 270 (28.8%)
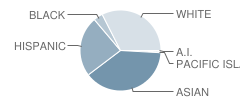
Student Enrollment Distribution by Race / Ethnicity
| Number | Percent | |
|---|---|---|
| American Indian | 5 | 0.5% |
| Black | 35 | 3.7% |
| Asian | 351 | 37.5% |
| Hispanic | 219 | 23.4% |
| White | 294 | 31.4% |
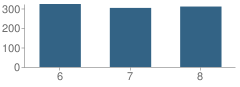
Number of Students Per Grade
| Number | Percent | |
|---|---|---|
| 6th Grade | 323 | 34.5% |
| 7th Grade | 303 | 32.4% |
| 8th Grade | 310 | 33.1% |
Teacher Education Background (2009)
Percent With Ph.D.
School:
2.1%
District:
2.6%
Percent With Master's Degree
School:
21.3%
District:
35.9%
Percent With Bachelor's Degree
School:
27.7%
District:
20.5%
Teacher Credentials & Experience (2009)
Percent of Teachers With Emergency Credentials: 4.9%
Percent of Teachers With Credentials: 95.1%
Number of Certificated Staff: 47.0
Average Number of Years of Teacher Experience: 10.0
Average Age
School:
40.9
District:
44.8
Source: CA Department of Education, Source: NCES 2009-2010
School Ratings and Reviews
Be The First To Review Marian A. Peterson Middle School!
School Map and Similar Schools Nearby
Click to Activate Map of Nearby School Campuses
Private
Public
This School
Similar Schools Nearby
| Sunnyvale Middle School 6-8 | 1,028 Students | 2.6 miles away | Not Yet Rated | |
| Cupertino Middle School 6-8 | 1,264 Students | 2.9 miles away | Not Yet Rated | |
| Oak Avenue Elementary School KG-6 | 450 Students | 3.5 miles away | Not Yet Rated | |
| Georgina P. Blach Intermediate School 7-8 | 449 Students | 4.2 miles away | Not Yet Rated | |
| Loyola Elementary School KG-6 | 571 Students | 4.7 miles away | Not Yet Rated | |
| Isaac Newton Graham Middle School 6-8 | 696 Students | 4.8 miles away | Not Yet Rated | |
| Springer Elementary School KG-6 | 521 Students | 4.9 miles away | Not Yet Rated | |
| Covington Elementary School KG-6 | 455 Students | 5.6 miles away | Not Yet Rated | |
| Almond Elementary School KG-6 | 538 Students | 5.6 miles away | Not Yet Rated | |
| Crittenden Middle School 6-8 | 584 Students | 6.0 miles away | Not Yet Rated | |
Compare This School To Nearby Schools ->
School Community Forum

Join a discussion about Marian A. Peterson Middle School and talk to others in the community including students, parents, teachers, and administrators.
Popular Discussion Topics
- Admissions and Registration Questions (e.g. Dress Code and Discipline Policy)
- School Calendar and Upcoming Events (e.g. Graduation)
- After School Programs, Extracurricular Activities, and Athletics (e.g. Football)
- News and Announcements (e.g. Yearbook and Class Supply List Details)
- Graduate and Alumni Events (e.g. Organizing Class Reunions)
Navigation
Can't Find What You Are Looking For?
Rankings
Nearby Cities
Sponsored Links
K-12 Articles

Helping Young Children with Printing and Cursive Writing
Is your child experiencing difficulty printing or writing? Is he unable to print or write legibly,...
Is your child experiencing difficulty printing or writing? Is he unable to print or write legibly,...

The Importance of Ninth Grade
Students who are entering ninth grade do not realize the importance of the critical decisions they...
Students who are entering ninth grade do not realize the importance of the critical decisions they...

National Memories
Few events are seared into our memory, and bring the country together-not as Democrat and...
Few events are seared into our memory, and bring the country together-not as Democrat and...