Mountain View Elementary School
Rating
Not Available
Not Available

5 out of 5 | 1 Review
Find Old Friends From Mountain View Elementary School
Use the form below to search for alumni from Mountain View Elementary School.
School Description
School Summary and Highlights
- Enrolls 664 elementary school students from grades KG-6
- Ranks 3821st out of 5,423 elementary schools in CA.
- 2010 Overall School AYP Met Status: No
School Operational Details
- Title I EligibleAll students of this school are eligible for participation in authorized programs.
School District Details
- Visalia Unified School District
- Per-Pupil Spending: $8,127
- Graduation Rate: 72.5%
- Dropout Rate: 3.7%
- Students Per Teacher: 24.3
- Enrolled Students: 26,954
Faculty Details and Student Enrollment
Students and Faculty
- Total Students Enrolled: 664
- Total Full Time "Equivalent" Teachers: 26.0
- Average Student-To-Teacher Ratio: 25.5
Students Gender Breakdown
- Males: 339 (51.1%)
- Females: 325 (48.9%)
Free Lunch Student Eligibility Breakdown
- Eligible for Reduced Lunch: 75 (11.3%)
- Eligible for Free Lunch: 280 (42.2%)
- Eligible for Either Reduced or Free Lunch: 355 (53.5%)
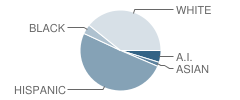
Student Enrollment Distribution by Race / Ethnicity
| Number | Percent | |
|---|---|---|
| American Indian | 31 | 4.7% |
| Black | 25 | 3.8% |
| Asian | 11 | 1.7% |
| Hispanic | 331 | 49.8% |
| White | 257 | 38.7% |
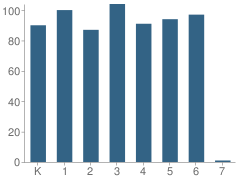
Number of Students Per Grade
| Number | Percent | |
|---|---|---|
| Kindergarten | 90 | 13.6% |
| 1st Grade | 100 | 15.1% |
| 2nd Grade | 87 | 13.1% |
| 3rd Grade | 104 | 15.7% |
| 4th Grade | 91 | 13.7% |
| 5th Grade | 94 | 14.2% |
| 6th Grade | 97 | 14.6% |
| 7th Grade | 1 | 0.2% |
Teacher Education Background (2009)
Percent With Ph.D.
School:
3.1%
District:
1.6%
Percent With Master's Degree
School:
25.0%
District:
45.1%
Percent With Bachelor's Degree
School:
9.4%
District:
12.3%
Teacher Credentials & Experience (2009)
Percent of Teachers With Credentials: 100.0%
Number of Certificated Staff: 32.0
Average Number of Years of Teacher Experience: 13.6
Average Age
School:
41.9
District:
46.1
Source: CA Department of Education, Source: NCES 2009-2010
School Ratings and Reviews
Overall Rating: 5

5 out of 5 | 1 Review
The Overall Rating is the school's average rating from parents, students, school faculty and staff. The highest rating is five apples and the lowest is one apple.
Share Your Review About This School
1 review for Mountain View Elementary School
- Reviewed by Staff Member on September 02, 2008
- Rating:
 (5 / 5) Flag as inappropriate
 - Great School! They go above and beyond!
School Map and Similar Schools Nearby
Click to Activate Map of Nearby School Campuses
Private
Public
This School
Similar Schools Nearby
| Conyer Elementary School KG-6 | 462 Students | 0.9 miles away |  5 out of 5 | |
| Washington Elementary School KG-6 | 331 Students | 0.9 miles away | Not Yet Rated | |
| Union Elementary School KG-6 | 643 Students | 1.3 miles away | Not Yet Rated | |
| Royal Oaks Elementary School KG-6 | 649 Students | 1.5 miles away | Not Yet Rated | |
| Pinkham Elementary School KG-6 | 630 Students | 1.6 miles away | Not Yet Rated | |
| Highland Elementary School KG-6 | 499 Students | 1.6 miles away | Not Yet Rated | |
| Crestwood Elementary School KG-6 | 721 Students | 1.7 miles away | 5 out of 5 | |
| Houston Elementary School KG-6 | 549 Students | 2.0 miles away | Not Yet Rated | |
| Cottonwood Creek Elementary School KG-6 | 695 Students | 2.2 miles away | Not Yet Rated | |
| Mineral King Elementary School KG-6 | 698 Students | 2.3 miles away | 5 out of 5 | |
Compare This School To Nearby Schools ->
School Community Forum

Join a discussion about Mountain View Elementary School and talk to others in the community including students, parents, teachers, and administrators.
Popular Discussion Topics
- Admissions and Registration Questions (e.g. Dress Code and Discipline Policy)
- School Calendar and Upcoming Events (e.g. Graduation)
- After School Programs, Extracurricular Activities, and Athletics (e.g. Football)
- News and Announcements (e.g. Yearbook and Class Supply List Details)
- Graduate and Alumni Events (e.g. Organizing Class Reunions)
Navigation
Can't Find What You Are Looking For?
Rankings
Nearby Cities
Sponsored Links
K-12 Articles

Public or Private?
Daniel attended private school until sixth grade, when he was diagnosed with Asperger's Syndrome, a...
Daniel attended private school until sixth grade, when he was diagnosed with Asperger's Syndrome, a...

Teaching Kids to Deal with Peer Pressure
Parents usually become very concerned when they hear the term "peer pressure." However, peer...
Parents usually become very concerned when they hear the term "peer pressure." However, peer...

Teach Your Child to Write Well
When American children head off to junior kindergarten, they must be ready to learn. It is your...
When American children head off to junior kindergarten, they must be ready to learn. It is your...