Westmorland Elementary School
Rating
Not Available
Not Available

5 out of 5 | 1 Review
Find Old Friends From Westmorland Elementary School
Use the form below to search for alumni from Westmorland Elementary School.
School Description
School Summary and Highlights
- Enrolls 384 elementary school students from grades KG-8
- Ranks 1875th out of 2,050 middle schools in CA.
- 2010 Overall School AYP Met Status: No
Additional Contact Information
- Mailing Address: PO Box 88, Westmorland, CA 92281
School Operational Details
- Title I EligibleAll students of this school are eligible for participation in authorized programs.
School District Details
- Westmorland Union Elementary School District
- Per-Pupil Spending: $11,245
- Students Per Teacher: 15.4
- Enrolled Students: 384
Faculty Details and Student Enrollment
Students and Faculty
- Total Students Enrolled: 384
- Total Full Time "Equivalent" Teachers: 25.0
- Average Student-To-Teacher Ratio: 15.4
Students Gender Breakdown
- Males: 187 (48.7%)
- Females: 197 (51.3%)
Free Lunch Student Eligibility Breakdown
- Eligible for Reduced Lunch: 33 (8.6%)
- Eligible for Free Lunch: 307 (79.9%)
- Eligible for Either Reduced or Free Lunch: 340 (88.5%)
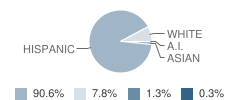
Student Enrollment Distribution by Race / Ethnicity
| Number | Percent | |
|---|---|---|
| American Indian | 1 | 0.3% |
| Black | - | - |
| Asian | 5 | 1.3% |
| Hispanic | 347 | 90.4% |
| White | 30 | 7.8% |
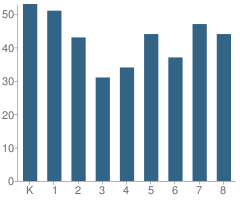
Number of Students Per Grade
| Number | Percent | |
|---|---|---|
| Kindergarten | 53 | 13.8% |
| 1st Grade | 51 | 13.3% |
| 2nd Grade | 43 | 11.2% |
| 3rd Grade | 31 | 8.1% |
| 4th Grade | 34 | 8.9% |
| 5th Grade | 44 | 11.5% |
| 6th Grade | 37 | 9.6% |
| 7th Grade | 47 | 12.2% |
| 8th Grade | 44 | 11.5% |
Teacher Education Background (2009)
Percent With Master's Degree: 16.7%
Percent With Bachelor's Degree: 50.0%
Teacher Credentials & Experience (2009)
Percent of Teachers With Emergency Credentials: 21.2%
Percent of Teachers With Credentials: 72.7%
Number of Certificated Staff: 36.0
Average Number of Years of Teacher Experience: 9.9
Average Age: 38.6
Source: CA Department of Education, Source: NCES 2009-2010
School Ratings and Reviews
Overall Rating: 5

5 out of 5 | 1 Review
The Overall Rating is the school's average rating from parents, students, school faculty and staff. The highest rating is five apples and the lowest is one apple.
Share Your Review About This School
1 review for Westmorland Elementary School
- Reviewed by Parent/Guardian on September 15, 2008
- Rating:
 (5 / 5) Flag as inappropriate
 - This isn't a review...it's a request to the school district:
My grandmother, Helen Lucile Shaw (later, Helen Shaw Taylor), taught at Westmorland Elementary School in 1915. I wonder if there are any pictures of this year which might include my grandmother--of which I might obtain copies.
Her son, my 88-year-old father, went on to become a school superintendent, and he would love to have copies of anything relating to his mother from your school.
Four of her granddaughters (of which I am one) are now teachers.
If you have any records or pictures you might copy and email, my address is:
[email protected]
The whole family would enjoy her memories; but my father would particularly treasure them.
Thank you for any help!
Sincerely,
Bev Meier
School Map and Similar Schools Nearby
Click to Activate Map of Nearby School Campuses
Private
Public
This School
Similar Schools Nearby
| Phil D. Swing Elementary School KG-6 | 757 Students | 5.6 miles away |  5 out of 5 | |
| Myron D. Witter Elementary School KG-3 | 742 Students | 6.3 miles away | Not Yet Rated | |
| J. W. Oakley Elementary School KG-3 | 797 Students | 6.9 miles away | Not Yet Rated | |
| Miguel Hidalgo Elementary School KG-6 | 708 Students | 6.9 miles away | Not Yet Rated | |
| Fremont Primary School KG-4 | 371 Students | 8.4 miles away | Not Yet Rated | |
| Bill E. Young Jr. Middle School 5-8 | 324 Students | 8.4 miles away | Not Yet Rated | |
| Mulberry Elementary School KG-8 | 90 Students | 11.3 miles away | Not Yet Rated | |
| Magnolia Elementary School KG-8 | 111 Students | 11.9 miles away | Not Yet Rated | |
| Ben Hulse Elementary School KG-5 | 984 Students | 13.4 miles away | 5 out of 5 | |
| T. L. Waggoner Elementary School KG-5 | 707 Students | 14.9 miles away | Not Yet Rated | |
Compare This School To Nearby Schools ->
School Community Forum

Join a discussion about Westmorland Elementary School and talk to others in the community including students, parents, teachers, and administrators.
Popular Discussion Topics
- Admissions and Registration Questions (e.g. Dress Code and Discipline Policy)
- School Calendar and Upcoming Events (e.g. Graduation)
- After School Programs, Extracurricular Activities, and Athletics (e.g. Football)
- News and Announcements (e.g. Yearbook and Class Supply List Details)
- Graduate and Alumni Events (e.g. Organizing Class Reunions)
Navigation
Can't Find What You Are Looking For?
Rankings
Nearby Cities
Sponsored Links
K-12 Articles

Middle School Homework and Study Habits
The report cards came home and you’re disappointed with your child’s scores. You know he has the...
The report cards came home and you’re disappointed with your child’s scores. You know he has the...

School Lunches ... Hot or Cold?
First there were four, now there are six, no one knows how many more there may be in the future....
First there were four, now there are six, no one knows how many more there may be in the future....

Breakfast, Kids and Learning
For generations parents have been telling their kids that breakfast is the most important meal of...
For generations parents have been telling their kids that breakfast is the most important meal of...