Westpark Elementary School
Rating
Not Available
Not Available

No Reviews Yet
Find Old Friends From Westpark Elementary School
Use the form below to search for alumni from Westpark Elementary School.
School Description
School Summary and Highlights
- Enrolls 582 elementary school students from grades KG-6
- Ranks 414th out of 5,423 elementary schools in CA.
- 2010 Overall School AYP Met Status: Yes
School District Details
- Irvine Unified School District
- Per-Pupil Spending: $8,512
- Graduation Rate: 99.6%
- Dropout Rate: 0.7%
- Students Per Teacher: 26.1
- Enrolled Students: 26,776
Faculty Details and Student Enrollment
Students and Faculty
- Total Students Enrolled: 582
- Total Full Time "Equivalent" Teachers: 25.8
- Average Student-To-Teacher Ratio: 22.6
Students Gender Breakdown
- Males: 315 (54.1%)
- Females: 267 (45.9%)
Free Lunch Student Eligibility Breakdown
- Eligible for Reduced Lunch: 19 (3.3%)
- Eligible for Free Lunch: 41 (7.0%)
- Eligible for Either Reduced or Free Lunch: 60 (10.3%)
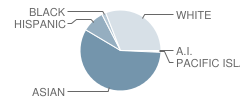
Student Enrollment Distribution by Race / Ethnicity
| Number | Percent | |
|---|---|---|
| American Indian | 2 | 0.3% |
| Black | 9 | 1.5% |
| Asian | 302 | 51.9% |
| Hispanic | 47 | 8.1% |
| White | 162 | 27.8% |
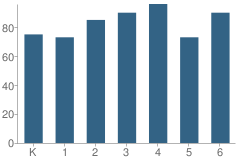
Number of Students Per Grade
| Number | Percent | |
|---|---|---|
| Kindergarten | 75 | 12.9% |
| 1st Grade | 73 | 12.5% |
| 2nd Grade | 85 | 14.6% |
| 3rd Grade | 90 | 15.5% |
| 4th Grade | 96 | 16.5% |
| 5th Grade | 73 | 12.5% |
| 6th Grade | 90 | 15.5% |
Teacher Education Background (2009)
Percent With Bachelor's Degree
School:
30.3%
District:
24.8%
Teacher Credentials & Experience (2009)
Percent of Teachers With Credentials: 100.0%
Number of Certificated Staff: 33.0
Average Number of Years of Teacher Experience: 13.5
Average Age
School:
38.9
District:
46.9
Source: CA Department of Education, Source: NCES 2009-2010
School Ratings and Reviews
Be The First To Review Westpark Elementary School!
School Map and Similar Schools Nearby
Click to Activate Map of Nearby School Campuses
Private
Public
This School
Similar Schools Nearby
| Culverdale Elementary School KG-6 | 640 Students | 0.7 miles away | Not Yet Rated | |
| Meadow Park School KG-6 | 597 Students | 1.3 miles away | Not Yet Rated | |
| University Park Elementary School KG-6 | 546 Students | 1.3 miles away | Not Yet Rated | |
| Plaza Vista School KG-8 | 929 Students | 1.5 miles away | Not Yet Rated | |
| Stone Creek Elementary School KG-6 | 536 Students | 1.9 miles away | Not Yet Rated | |
| Springbrook Elementary School KG-6 | 588 Students | 1.9 miles away | Not Yet Rated | |
| Eastshore Elementary School KG-6 | 554 Students | 2.2 miles away | Not Yet Rated | |
| Deerfield Elementary School KG-6 | 571 Students | 2.3 miles away | Not Yet Rated | |
| Turtle Rock Elementary School KG-6 | 776 Students | 2.4 miles away | Not Yet Rated | |
| Greentree Elementary School KG-6 | 523 Students | 2.7 miles away | Not Yet Rated | |
Compare This School To Nearby Schools ->
School Community Forum

Join a discussion about Westpark Elementary School and talk to others in the community including students, parents, teachers, and administrators.
Popular Discussion Topics
- Admissions and Registration Questions (e.g. Dress Code and Discipline Policy)
- School Calendar and Upcoming Events (e.g. Graduation)
- After School Programs, Extracurricular Activities, and Athletics (e.g. Football)
- News and Announcements (e.g. Yearbook and Class Supply List Details)
- Graduate and Alumni Events (e.g. Organizing Class Reunions)
Navigation
Can't Find What You Are Looking For?
Rankings
Nearby Cities
Sponsored Links
K-12 Articles

Democracy in Action
There is still over a year until the general election, but the election cycle has been in full...
There is still over a year until the general election, but the election cycle has been in full...

Breakfast, Kids and Learning
For generations parents have been telling their kids that breakfast is the most important meal of...
For generations parents have been telling their kids that breakfast is the most important meal of...

Teaching Children Respect
Statistics prove that there are many different family types in today’s society. Grandparents or a...
Statistics prove that there are many different family types in today’s society. Grandparents or a...