San Luis Obispo County Community School
Rating
Not Available
Not Available

No Reviews Yet
Find Old Friends From San Luis Obispo County Community School
Use the form below to search for alumni from San Luis Obispo County Community School.
School Description
School Summary and Highlights
- Enrolls 275 elementary, middle, and high school students from grades KG-12
- 2010 Overall School AYP Met Status: No
Additional Contact Information
- Mailing Address: 3350 Education Dr., San Luis Obispo, CA 93405
School Operational Details
- Alternative School
- Title I Eligible
School District Details
- San Luis Obispo County Office of Education School District
- Per-Pupil Spending: $39,797
- Graduation Rate: 82.6%
- Dropout Rate: 10.0%
- Students Per Teacher: 8.4
- Enrolled Students: 707
Faculty Details and Student Enrollment
Students and Faculty
- Total Students Enrolled: 275
- Total Full Time "Equivalent" Teachers: 18.3
- Average Student-To-Teacher Ratio: 15.1
Students Gender Breakdown
- Males: 193 (70.2%)
- Females: 82 (29.8%)
Free Lunch Student Eligibility Breakdown
- Eligible for Reduced Lunch: 38 (13.8%)
- Eligible for Free Lunch: 205 (74.5%)
- Eligible for Either Reduced or Free Lunch: 243 (88.4%)
Student Enrollment Distribution by Race / Ethnicity
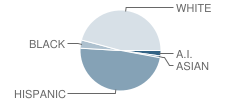
| Number | Percent | |
|---|---|---|
| American Indian | 6 | 2.2% |
| Black | 9 | 3.3% |
| Asian | 2 | 0.7% |
| Hispanic | 132 | 48.0% |
| White | 126 | 45.8% |
Number of Students Per Grade
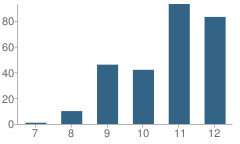
| Number | Percent | |
|---|---|---|
| 7th Grade | 1 | 0.4% |
| 8th Grade | 10 | 3.6% |
| 9th Grade | 46 | 16.7% |
| 10th Grade | 42 | 15.3% |
| 11th Grade | 93 | 33.8% |
| 12th Grade | 83 | 30.2% |
Graduates Information (2010)
Graduation Rate
School:
87.3%
District:
87.3%
State:
78.6%
Teacher Education Background (2009)
Percent With Master's Degree
School:
50.0%
District:
23.1%
Percent With Bachelor's Degree
School:
16.7%
District:
7.7%
Teacher Credentials & Experience (2009)
Percent of Teachers With Credentials: 100.0%
Number of Certificated Staff: 24.0
Average Number of Years of Teacher Experience: 10.5
Average Age
School:
42.0
District:
50.3
Source: CA Department of Education, Source: NCES 2009-2010
School Ratings and Reviews
Be The First To Review San Luis Obispo County Community School!
School Map and Similar Schools Nearby
Click to Activate Map of Nearby School Campuses
Private
Public
This School
Similar Schools Nearby
| San Luis Obispo County Juvenile Court School 6-12 | 31 Students | 0 miles away | Not Yet Rated | |
| Pacific Beach High School 9-12 | 54 Students | 6.4 miles away | Not Yet Rated | |
| West Mall Alternative School KG-12 | 108 Students | 12.9 miles away | Not Yet Rated | |
| Eagle Canyon High School 9-12 | 15 Students | 14.7 miles away | Not Yet Rated | |
| Templeton Independent Study High School 9-12 | 114 Students | 14.8 miles away | Not Yet Rated | |
| Liberty High (Continuation) School 9-12 | 133 Students | 19.9 miles away | Not Yet Rated | |
| Lopez Continuation High School 9-12 | 174 Students | 20.4 miles away | Not Yet Rated | |
| Cambria Community Day School 7-12 | 12 Students | 23.3 miles away | Not Yet Rated | - |
| Leffingwell High (Continuation) School 9-12 | 13 Students | 23.3 miles away | Not Yet Rated | |
| Phillips-Freedom Community Day School 7-12 | 29 Students | 25.9 miles away | Not Yet Rated | |
Compare This School To Nearby Schools ->
School Community Forum

Join a discussion about San Luis Obispo County Community School and talk to others in the community including students, parents, teachers, and administrators.
Popular Discussion Topics
- Admissions and Registration Questions (e.g. Dress Code and Discipline Policy)
- School Calendar and Upcoming Events (e.g. Graduation)
- After School Programs, Extracurricular Activities, and Athletics (e.g. Football)
- News and Announcements (e.g. Yearbook and Class Supply List Details)
- Graduate and Alumni Events (e.g. Organizing Class Reunions)
Navigation
Can't Find What You Are Looking For?
Rankings
Nearby Cities
Sponsored Links
K-12 Articles

Homework Helps
School has started throughout the country and is well into the first month-some schools are...
School has started throughout the country and is well into the first month-some schools are...

Making Sense of No Child Left Behind
The No Child Left Behind Act of 2001 has met with mixed results and mixed feelings. Some think it...
The No Child Left Behind Act of 2001 has met with mixed results and mixed feelings. Some think it...

The Impact on Adopted Children at School
Children who are adopted can be affected both academically and socially at school. Many times...
Children who are adopted can be affected both academically and socially at school. Many times...