Franklin Elementary School
Rating
Not Available
Not Available

5 out of 5 | 1 Review
Find Old Friends From Franklin Elementary School
Use the form below to search for alumni from Franklin Elementary School.
School Description
School Summary and Highlights
- Enrolls 224 preschool and elementary school students from grades PK-8
- Ranks 40th out of 250 middle schools in CT.
Additional Contact Information
- Mailing Address: 206 Pond Road, North Franklin, CT 06254
School Operational Details
- Title I Eligible
School District Details
- Franklin School District
- Per-Pupil Spending: $14,382
- Students Per Teacher: 12.0
- Enrolled Students: 224
Faculty Details and Student Enrollment
Students and Faculty
- Total Students Enrolled: 224
- Total Full Time "Equivalent" Teachers: 18.6
- Average Student-To-Teacher Ratio: 12.0
Students Gender Breakdown
- Males: 120 (53.6%)
- Females: 104 (46.4%)
Free Lunch Student Eligibility Breakdown
- Eligible for Reduced Lunch: 2 (0.9%)
- Eligible for Free Lunch: 22 (9.8%)
- Eligible for Either Reduced or Free Lunch: 24 (10.7%)
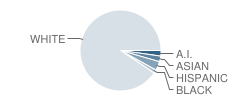
Student Enrollment Distribution by Race / Ethnicity
| Number | Percent | |
|---|---|---|
| American Indian | 5 | 2.2% |
| Black | 3 | 1.3% |
| Asian | 5 | 2.2% |
| Hispanic | 8 | 3.6% |
| White | 203 | 90.6% |
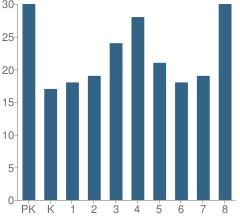
Number of Students Per Grade
| Number | Percent | |
|---|---|---|
| Pre-Kindergarten | 30 | 13.4% |
| Kindergarten | 17 | 7.6% |
| 1st Grade | 18 | 8.0% |
| 2nd Grade | 19 | 8.5% |
| 3rd Grade | 24 | 10.7% |
| 4th Grade | 28 | 12.5% |
| 5th Grade | 21 | 9.4% |
| 6th Grade | 18 | 8.0% |
| 7th Grade | 19 | 8.5% |
| 8th Grade | 30 | 13.4% |
Source: CT Department of Education, Source: NCES 2009-2010
School Ratings and Reviews
Overall Rating: 5

5 out of 5 | 1 Review
The Overall Rating is the school's average rating from parents, students, school faculty and staff. The highest rating is five apples and the lowest is one apple.
Share Your Review About This School
1 review for Franklin Elementary School
- Reviewed by Former Student on October 09, 2007
- Rating:
 (5 / 5) Flag as inappropriate
 - I went to F.E.S. for seven straight years and I loved every minute of it. The faculty and staff do all that is in their power to create a safe and structural atmosphere. I would recommend this school over all other as a school for your child to get their education- especially if he/she does better in a smaller, quieter learning environment. F.E.S. is a "Pre K-8" school.
School Map and Similar Schools Nearby
Click to Activate Map of Nearby School Campuses
Private
Public
This School
Similar Schools Nearby
| Sayles Elementary School PK-8 | 351 Students | 2.3 miles away | Not Yet Rated | |
| Lebanon Elementary School PK-4 | 494 Students | 4.2 miles away | Not Yet Rated | |
| Fields Memorial School PK-8 | 256 Students | 4.8 miles away | Not Yet Rated | |
| John M. Moriarty School PK-5 | 366 Students | 5.0 miles away | Not Yet Rated | |
| Windham Center School KG-4 | 315 Students | 5.3 miles away | Not Yet Rated | |
| Wequonnoc School PK-5 | 236 Students | 5.5 miles away | Not Yet Rated | |
| Scotland Elementary School PK-6 | 161 Students | 5.6 miles away | Not Yet Rated | |
| Samuel Huntington School PK-5 | 411 Students | 5.7 miles away | Not Yet Rated | |
| Lebanon Middle School 5-8 | 404 Students | 5.7 miles away | Not Yet Rated | |
| Lisbon Central School PK-8 | 545 Students | 5.9 miles away | Not Yet Rated | |
Compare This School To Nearby Schools ->
School Community Forum

Join a discussion about Franklin Elementary School and talk to others in the community including students, parents, teachers, and administrators.
Popular Discussion Topics
- Admissions and Registration Questions (e.g. Dress Code and Discipline Policy)
- School Calendar and Upcoming Events (e.g. Graduation)
- After School Programs, Extracurricular Activities, and Athletics (e.g. Football)
- News and Announcements (e.g. Yearbook and Class Supply List Details)
- Graduate and Alumni Events (e.g. Organizing Class Reunions)
Navigation
Can't Find What You Are Looking For?
Rankings
Nearby Cities
Sponsored Links
K-12 Articles

Help Your High School Student Create an Impressive Resume
Time has flown. Your teen is in high school and has demonstrated an interest in obtaining a part...
Time has flown. Your teen is in high school and has demonstrated an interest in obtaining a part...

The Adolescent Monster
"What happened to my sweet little baby?" Every parent has or will ask that sometime during the...
"What happened to my sweet little baby?" Every parent has or will ask that sometime during the...

Cell Phones... the Best Thing Since Sliced Bread or the Worst Invention in the World?
Cell phones are wonderful, the best things humans have ever invented! They help us keep in touch...
Cell phones are wonderful, the best things humans have ever invented! They help us keep in touch...