Sherman School
Rating
Not Available
Not Available

No Reviews Yet
Find Old Friends From Sherman School
Use the form below to search for alumni from Sherman School.
School Description
School Summary and Highlights
- Enrolls 444 preschool and elementary school students from grades PK-8
- Ranks 59th out of 250 middle schools in CT.
School Operational Details
- Title I Eligible
School District Details
- Sherman School District
- Per-Pupil Spending: $14,382
- Students Per Teacher: 11.9
- Enrolled Students: 444
Faculty Details and Student Enrollment
Students and Faculty
- Total Students Enrolled: 444
- Total Full Time "Equivalent" Teachers: 37.4
- Average Student-To-Teacher Ratio: 11.9
Students Gender Breakdown
- Males: 230 (51.8%)
- Females: 214 (48.2%)
Free Lunch Student Eligibility Breakdown
- Eligible for Reduced Lunch: - (-)
- Eligible for Free Lunch: 13 (2.9%)
- Eligible for Either Reduced or Free Lunch: 13 (2.9%)
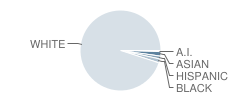
Student Enrollment Distribution by Race / Ethnicity
| Number | Percent | |
|---|---|---|
| American Indian | 2 | 0.5% |
| Black | 7 | 1.6% |
| Asian | 8 | 1.8% |
| Hispanic | 5 | 1.1% |
| White | 422 | 95.0% |
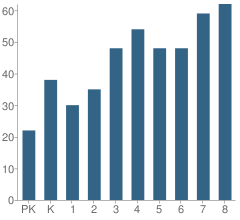
Number of Students Per Grade
| Number | Percent | |
|---|---|---|
| Pre-Kindergarten | 22 | 5.0% |
| Kindergarten | 38 | 8.6% |
| 1st Grade | 30 | 6.8% |
| 2nd Grade | 35 | 7.9% |
| 3rd Grade | 48 | 10.8% |
| 4th Grade | 54 | 12.2% |
| 5th Grade | 48 | 10.8% |
| 6th Grade | 48 | 10.8% |
| 7th Grade | 59 | 13.3% |
| 8th Grade | 62 | 14.0% |
Source: CT Department of Education, Source: NCES 2009-2010
School Ratings and Reviews
Be The First To Review Sherman School!
School Map and Similar Schools Nearby
Click to Activate Map of Nearby School Campuses
Private
Public
This School
Similar Schools Nearby
| Sarah Noble Intermediate School 4-6 | 1,086 Students | 4.1 miles away |  4.5 out of 5 | |
| John Pettibone School PK-3 | 448 Students | 4.3 miles away |  5 out of 5 | |
| Hill and Plain School PK-3 | 449 Students | 4.6 miles away | Not Yet Rated | |
| Northville Elementary School PK-3 | 534 Students | 6.0 miles away | 5 out of 5 | |
| The Burnham School KG-5 | 87 Students | 7.2 miles away | Not Yet Rated | |
| Consolidated School PK-2 | 649 Students | 8.1 miles away | Not Yet Rated | - |
| Meeting House Hill School 3-5 | 637 Students | 8.1 miles away | Not Yet Rated | |
| Booth Free School KG-5 | 112 Students | 9.9 miles away | Not Yet Rated | |
| Center Elementary School PK-1 | 419 Students | 9.9 miles away | Not Yet Rated | - |
| Huckleberry Hill Elementary School 2-4 | 546 Students | 9.9 miles away | Not Yet Rated | |
Compare This School To Nearby Schools ->
School Community Forum

Join a discussion about Sherman School and talk to others in the community including students, parents, teachers, and administrators.
Popular Discussion Topics
- Admissions and Registration Questions (e.g. Dress Code and Discipline Policy)
- School Calendar and Upcoming Events (e.g. Graduation)
- After School Programs, Extracurricular Activities, and Athletics (e.g. Football)
- News and Announcements (e.g. Yearbook and Class Supply List Details)
- Graduate and Alumni Events (e.g. Organizing Class Reunions)
Navigation
Can't Find What You Are Looking For?
Rankings
Nearby Cities
Sponsored Links
K-12 Articles

Parent and Family Involvement in School
When visiting my grandson’s school, I often hear administrators and teachers complaining that not...
When visiting my grandson’s school, I often hear administrators and teachers complaining that not...

Transform Your Middle School Slacker into a Scholar
All children need motivation to learn. Have your child’s grades decreased since he started middle...
All children need motivation to learn. Have your child’s grades decreased since he started middle...

Bullies... What Are They Good For?
Bullies have been around since the beginning of time. We had to deal with bullies, and our parents...
Bullies have been around since the beginning of time. We had to deal with bullies, and our parents...