Westfield Community School
Rating
Not Available
Not Available

5 out of 5 | 1 Review
Find Old Friends From Westfield Community School
Use the form below to search for alumni from Westfield Community School.
School Description
School Summary and Highlights
- Enrolls 1,726 elementary school students from grades KG-8
- Ranks 392nd out of 1,366 middle schools in IL.
Additional Contact Information
- Principal or Admin: Bill Doran
School District Details
- Community Unit School District - Cusd 300
- Per-Pupil Spending: $8,867
- Graduation Rate: 87.0%
- Dropout Rate: 2.6%
- Students Per Teacher: 17.2
- Enrolled Students: 20,216
Faculty Details and Student Enrollment
Students and Faculty
- Total Students Enrolled: 1,726
- Total Full Time "Equivalent" Teachers: 98.9
- Average Student-To-Teacher Ratio: 17.5
Students Gender Breakdown
- Males: 845 (49.0%)
- Females: 824 (47.7%)
Free Lunch Student Eligibility Breakdown
- Eligible for Reduced Lunch: 64 (3.7%)
- Eligible for Free Lunch: 209 (12.1%)
- Eligible for Either Reduced or Free Lunch: 273 (15.8%)
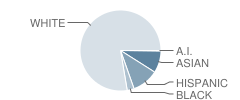
Student Enrollment Distribution by Race / Ethnicity
| Number | Percent | |
|---|---|---|
| American Indian | 4 | 0.2% |
| Black | 46 | 2.7% |
| Asian | 146 | 8.5% |
| Hispanic | 177 | 10.3% |
| White | 1,296 | 75.1% |
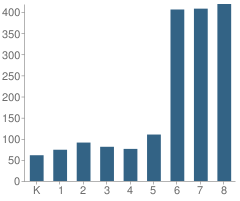
Number of Students Per Grade
| Number | Percent | |
|---|---|---|
| Kindergarten | 61 | 3.5% |
| 1st Grade | 74 | 4.3% |
| 2nd Grade | 91 | 5.3% |
| 3rd Grade | 81 | 4.7% |
| 4th Grade | 76 | 4.4% |
| 5th Grade | 110 | 6.4% |
| 6th Grade | 406 | 23.5% |
| 7th Grade | 408 | 23.6% |
| 8th Grade | 419 | 24.3% |
Attendance, Graduation, and Dropout Rates (2010)
Attendance Rate
School:
96.1%
District:
94.7%
State:
93.9%
Teacher Credentials (2010)
Percent of Teachers with Emergency or Provisional Credentials
School:
1.0%
District:
0.4%
State:
0.5%
Source: IL Department of Education, Source: NCES 2009-2010
School Ratings and Reviews
Overall Rating: 5

5 out of 5 | 1 Review
The Overall Rating is the school's average rating from parents, students, school faculty and staff. The highest rating is five apples and the lowest is one apple.
Share Your Review About This School
1 review for Westfield Community School
- Reviewed by Parent/Guardian on June 01, 2010
- Rating:
 (5 / 5) Flag as inappropriate
 - Westfield community school is a great school for kids! I've only been going there ever since the first day of school, but I really liked it better than my old school!
School Map and Similar Schools Nearby
Click to Activate Map of Nearby School Campuses
Private
Public
This School
Similar Schools Nearby
| Liberty Elementary School KG-5 | 772 Students | 1.5 miles away |  5 out of 5 | |
| Kenneth E Neubert Elementary School KG-5 | 555 Students | 1.8 miles away | Not Yet Rated | |
| Algonquin Lakes Elementary School KG-5 | 590 Students | 2.4 miles away | Not Yet Rated | |
| Eastview Elementary School KG-5 | 440 Students | 2.4 miles away | Not Yet Rated | |
| Mackeben Elementary School KG-2 | 689 Students | 2.8 miles away | Not Yet Rated | - |
| Conley Elementary School 3-5 | 731 Students | 2.9 miles away | Not Yet Rated | |
| Gilberts Elementary School PK-5 | 741 Students | 3.0 miles away | Not Yet Rated | |
| Perry Elementary School PK-4 | 728 Students | 3.0 miles away | Not Yet Rated | |
| Parkview Elementary School KG-4 | 425 Students | 3.3 miles away |  1 out of 5 | |
| Indian Prairie Elementary School KG-5 | 630 Students | 3.5 miles away | Not Yet Rated | |
Compare This School To Nearby Schools ->
School Community Forum

Join a discussion about Westfield Community School and talk to others in the community including students, parents, teachers, and administrators.
Popular Discussion Topics
- Admissions and Registration Questions (e.g. Dress Code and Discipline Policy)
- School Calendar and Upcoming Events (e.g. Graduation)
- After School Programs, Extracurricular Activities, and Athletics (e.g. Football)
- News and Announcements (e.g. Yearbook and Class Supply List Details)
- Graduate and Alumni Events (e.g. Organizing Class Reunions)
Navigation
Can't Find What You Are Looking For?
Rankings
Nearby Cities
Sponsored Links
K-12 Articles

Everyone Loves Going to the Doctor and Dentist
Going to the doctor or dentist can be traumatic for children of all ages. Many adults do not...
Going to the doctor or dentist can be traumatic for children of all ages. Many adults do not...

Educators and Childhood Obesity
Obesity in childhood is rising to epidemic proportions in America and educators should be...
Obesity in childhood is rising to epidemic proportions in America and educators should be...

Attend Your Teen's Holiday Parties
Christmas and New Years are coming, and with them Christmas and New Years Eve parties. At many of...
Christmas and New Years are coming, and with them Christmas and New Years Eve parties. At many of...