Alcott Elementary School
Rating
Not Available
Not Available

No Reviews Yet
Find Old Friends From Alcott Elementary School
Use the form below to search for alumni from Alcott Elementary School.
School Description
School Summary and Highlights
- Enrolls 498 preschool and elementary school students from grades PK-8
- Ranks 336th out of 1,366 middle schools in IL.
Additional Contact Information
- Mailing Address: 2625 N Orchard St, Chicago, IL 60614
- Principal or Admin: David J Domovic
School District Details
- Chicago Public Schools
- Per-Pupil Spending: $10,392
- Graduation Rate: 63.8%
- Dropout Rate: 16.3%
- Students Per Teacher: 17.8
- Enrolled Students: 406,068
Faculty Details and Student Enrollment
Students and Faculty
- Total Students Enrolled: 498
- Total Full Time "Equivalent" Teachers: 32.0
- Average Student-To-Teacher Ratio: 15.6
Students Gender Breakdown
- Males: 230 (46.2%)
- Females: 268 (53.8%)
Free Lunch Student Eligibility Breakdown
- Eligible for Reduced Lunch: 48 (9.6%)
- Eligible for Free Lunch: 140 (28.1%)
- Eligible for Either Reduced or Free Lunch: 188 (37.8%)
Student Enrollment Distribution by Race / Ethnicity

| Number | Percent | |
|---|---|---|
| American Indian | 2 | 0.4% |
| Black | 77 | 15.5% |
| Asian | 35 | 7.0% |
| Hispanic | 84 | 16.9% |
| White | 300 | 60.2% |
Number of Students Per Grade
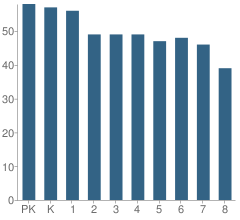
| Number | Percent | |
|---|---|---|
| Pre-Kindergarten | 58 | 11.6% |
| Kindergarten | 57 | 11.4% |
| 1st Grade | 56 | 11.2% |
| 2nd Grade | 49 | 9.8% |
| 3rd Grade | 49 | 9.8% |
| 4th Grade | 49 | 9.8% |
| 5th Grade | 47 | 9.4% |
| 6th Grade | 48 | 9.6% |
| 7th Grade | 46 | 9.2% |
| 8th Grade | 39 | 7.8% |
Attendance, Graduation, and Dropout Rates (2010)
Attendance Rate
School:
96.1%
District:
91.5%
State:
93.9%
Source: IL Department of Education, Source: NCES 2009-2010
School Ratings and Reviews
Be The First To Review Alcott Elementary School!
School Map and Similar Schools Nearby
Click to Activate Map of Nearby School Campuses
Private
Public
This School
Similar Schools Nearby
| Agassiz Elementary School PK-8 | 384 Students | 0.6 miles away | Not Yet Rated | |
| Nettelhorst Elementary School PK-8 | 632 Students | 0.8 miles away |  5 out of 5 | |
| Hawthorne Elementary Scholastic Academy KG-8 | 564 Students | 0.9 miles away | Not Yet Rated | |
| Burley Elementary School PK-8 | 534 Students | 1.3 miles away | 5 out of 5 | |
| Inter-American Elementary Magnet School PK-8 | 692 Students | 1.3 miles away |  3.5 out of 5 | |
| Greeley Elementary School PK-8 | 541 Students | 1.6 miles away | Not Yet Rated | |
| Manierre Elementary School PK-8 | 508 Students | 1.6 miles away |  3 out of 5 | |
| Hamilton Elementary School PK-8 | 244 Students | 1.6 miles away | Not Yet Rated | |
| Jahn Elementary School PK-8 | 434 Students | 1.6 miles away | 5 out of 5 | |
| Burr Elementary School PK-8 | 321 Students | 1.7 miles away |  4 out of 5 | |
Compare This School To Nearby Schools ->
School Community Forum

Join a discussion about Alcott Elementary School and talk to others in the community including students, parents, teachers, and administrators.
Popular Discussion Topics
- Admissions and Registration Questions (e.g. Dress Code and Discipline Policy)
- School Calendar and Upcoming Events (e.g. Graduation)
- After School Programs, Extracurricular Activities, and Athletics (e.g. Football)
- News and Announcements (e.g. Yearbook and Class Supply List Details)
- Graduate and Alumni Events (e.g. Organizing Class Reunions)
Navigation
Can't Find What You Are Looking For?
Rankings
Sponsored Links
K-12 Articles

Changing Schools Isn't Easy: Tips for a Successful Transition
It isn’t easy for students to make the transition into a new school, especially if they have...
It isn’t easy for students to make the transition into a new school, especially if they have...

Nothing New Under the Sun
“I had to go through the same thing when I went to school.” Every parent has uttered this phrase,...
“I had to go through the same thing when I went to school.” Every parent has uttered this phrase,...

Kids and Competition
In the backyard, the classroom, the community and while participating in sports and other...
In the backyard, the classroom, the community and while participating in sports and other...