Forreston High School
Rating
Not Available
Not Available

5 out of 5 | 1 Review
Find Old Friends From Forreston High School
Use the form below to search for alumni from Forreston High School.
School Description
School Summary and Highlights
- Enrolls 476 middle and high school students from grades 6-12
- Ranks 297th out of 640 high schools in IL.
Additional Contact Information
- Mailing Address: PO Box 665, Forreston, IL 61030
- Principal or Admin: Christopher Shockey
School Operational Details
- Title I Eligible
School District Details
- Forrestville Valley Community Unit School District - Cusd 221
- Per-Pupil Spending: $8,405
- Graduation Rate: 86.6%
- Students Per Teacher: 14.0
- Enrolled Students: 890
Faculty Details and Student Enrollment
Students and Faculty
- Total Students Enrolled: 476
- Total Full Time "Equivalent" Teachers: 38.0
- Average Student-To-Teacher Ratio: 12.5
Students Gender Breakdown
- Males: 244 (51.3%)
- Females: 224 (47.1%)
Free Lunch Student Eligibility Breakdown
- Eligible for Reduced Lunch: 21 (4.4%)
- Eligible for Free Lunch: 82 (17.2%)
- Eligible for Either Reduced or Free Lunch: 103 (21.6%)
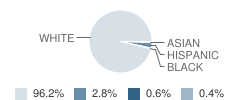
Student Enrollment Distribution by Race / Ethnicity
| Number | Percent | |
|---|---|---|
| American Indian | - | - |
| Black | 2 | 0.4% |
| Asian | 3 | 0.6% |
| Hispanic | 13 | 2.7% |
| White | 450 | 94.5% |
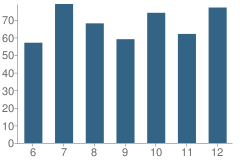
Number of Students Per Grade
| Number | Percent | |
|---|---|---|
| 6th Grade | 57 | 12.0% |
| 7th Grade | 79 | 16.6% |
| 8th Grade | 68 | 14.3% |
| 9th Grade | 59 | 12.4% |
| 10th Grade | 74 | 15.5% |
| 11th Grade | 62 | 13.0% |
| 12th Grade | 77 | 16.2% |
Attendance, Graduation, and Dropout Rates (2010)
Attendance Rate
School:
95.3%
District:
95.8%
State:
93.9%
Graduation Rate
School:
94.9%
District:
94.9%
State:
87.8%
Teacher Credentials (2010)
Percent of Teachers with Emergency or Provisional Credentials
School:
2.6%
District:
1.6%
State:
0.5%
Source: IL Department of Education, Source: NCES 2009-2010
School Ratings and Reviews
Overall Rating: 5

5 out of 5 | 1 Review
The Overall Rating is the school's average rating from parents, students, school faculty and staff. The highest rating is five apples and the lowest is one apple.
Share Your Review About This School
1 review for Forreston High School
- Reviewed by Former Student on April 13, 2011
- Rating:
 (5 / 5) Flag as inappropriate
 - I graduated from here in May of 2010. It was a good school with a wide array of courses. The school does require more credits than some though.
School Map and Similar Schools Nearby
Click to Activate Map of Nearby School Campuses
Private
Public
This School
Similar Schools Nearby
| Black Hawk Jr High School 7-8 | 255 Students | 9.2 miles away | Not Yet Rated | |
| Polo Community High School 9-12 | 224 Students | 9.8 miles away | Not Yet Rated | |
| Freeport Jr High School 7-8 | 633 Students | 11.4 miles away | Not Yet Rated | |
| Freeport High School 9-12 | 1,284 Students | 11.5 miles away | Not Yet Rated | |
| Eastland High School 9-12 | 232 Students | 13.3 miles away | Not Yet Rated | |
| Oregon High School 9-12 | 532 Students | 14.3 miles away |  4 out of 5 | |
| Milledgeville High School 9-12 | 124 Students | 15.1 miles away | Not Yet Rated | |
| Byron High School 9-12 9-12 | 569 Students | 15.9 miles away | Not Yet Rated | |
| Pearl City Jr High School 7-8 | 98 Students | 16.3 miles away | Not Yet Rated | |
| Pearl City High School 9-12 | 160 Students | 16.3 miles away | Not Yet Rated | |
Compare This School To Nearby Schools ->
School Community Forum

Join a discussion about Forreston High School and talk to others in the community including students, parents, teachers, and administrators.
Popular Discussion Topics
- Admissions and Registration Questions (e.g. Dress Code and Discipline Policy)
- School Calendar and Upcoming Events (e.g. Graduation)
- After School Programs, Extracurricular Activities, and Athletics (e.g. Football)
- News and Announcements (e.g. Yearbook and Class Supply List Details)
- Graduate and Alumni Events (e.g. Organizing Class Reunions)
Navigation
Can't Find What You Are Looking For?
Rankings
Nearby Cities
Sponsored Links
K-12 Articles

Changing Schools Isn't Easy: Tips for a Successful Transition
It isn’t easy for students to make the transition into a new school, especially if they have...
It isn’t easy for students to make the transition into a new school, especially if they have...

The Impact on Adopted Children at School
Children who are adopted can be affected both academically and socially at school. Many times...
Children who are adopted can be affected both academically and socially at school. Many times...

Help Your High School Student Create an Impressive Resume
Time has flown. Your teen is in high school and has demonstrated an interest in obtaining a part...
Time has flown. Your teen is in high school and has demonstrated an interest in obtaining a part...