Rhodes Elementary School
8931 West Fullerton Ave, River Grove, IL 60171 | (708) 453-6813
- Grades: PK-8
- Student Enrollment: 628
Rating
Not Available
Not Available

5 out of 5 | 2 Reviews
Find Old Friends From Rhodes Elementary School
Use the form below to search for alumni from Rhodes Elementary School.
School Description
School Summary and Highlights
- Enrolls 628 preschool and elementary school students from grades PK-8
- Ranks 669th out of 1,366 middle schools in IL.
Additional Contact Information
- Mailing Address: 8931 W Fullerton Ave, River Grove, IL 60171
- Principal or Admin: Debra Suhajda
School Operational Details
- Title I Eligible
School District Details
- Rhodes School District 84-5
- Per-Pupil Spending: $12,083
- Students Per Teacher: 14.8
- Enrolled Students: 628
Faculty Details and Student Enrollment
Students and Faculty
- Total Students Enrolled: 628
- Total Full Time "Equivalent" Teachers: 42.4
- Average Student-To-Teacher Ratio: 14.8
Students Gender Breakdown
- Males: 305 (48.6%)
- Females: 314 (50.0%)
Free Lunch Student Eligibility Breakdown
- Eligible for Reduced Lunch: 34 (5.4%)
- Eligible for Free Lunch: 240 (38.2%)
- Eligible for Either Reduced or Free Lunch: 274 (43.6%)
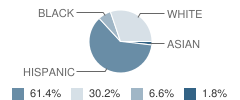
Student Enrollment Distribution by Race / Ethnicity
| Number | Percent | |
|---|---|---|
| American Indian | - | - |
| Black | 41 | 6.5% |
| Asian | 11 | 1.8% |
| Hispanic | 380 | 60.5% |
| White | 187 | 29.8% |
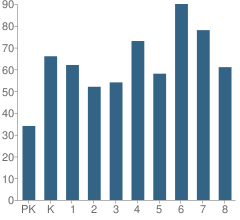
Number of Students Per Grade
| Number | Percent | |
|---|---|---|
| Pre-Kindergarten | 34 | 5.4% |
| Kindergarten | 66 | 10.5% |
| 1st Grade | 62 | 9.9% |
| 2nd Grade | 52 | 8.3% |
| 3rd Grade | 54 | 8.6% |
| 4th Grade | 73 | 11.6% |
| 5th Grade | 58 | 9.2% |
| 6th Grade | 90 | 14.3% |
| 7th Grade | 78 | 12.4% |
| 8th Grade | 61 | 9.7% |
Attendance, Graduation, and Dropout Rates (2010)
Attendance Rate
School:
95.4%
District:
95.4%
State:
93.9%
Source: IL Department of Education, Source: NCES 2009-2010
School Ratings and Reviews
Overall Rating: 5

5 out of 5 | 2 Reviews
The Overall Rating is the school's average rating from parents, students, school faculty and staff. The highest rating is five apples and the lowest is one apple.
Share Your Review About This School
2 reviews for Rhodes Elementary School
- Reviewed by Parent/Guardian on November 19, 2008
- Rating:
 (5 / 5) Flag as inappropriate
 - It is a very good school. Great staff...
- Reviewed by Parent/Guardian on June 30, 2007
- Rating: (5 / 5) Flag as inappropriate
- This school thinks they are private-but are very below a lot of schools as far as scale of learning they should be on. They will graduate all students, because they want them to look good. Teachers make way too much for the small classes.
School Map and Similar Schools Nearby
Click to Activate Map of Nearby School Campuses
Private
Public
This School
Similar Schools Nearby
| River Grove Elementary School PK-8 | 652 Students | 0.7 miles away | Not Yet Rated | |
| Dan H Pietrini Elementary School PK-5 | 289 Students | 0.8 miles away |  5 out of 5 | |
| Passow Elementary School PK-5 | 382 Students | 1.1 miles away | 5 out of 5 | |
| Scott Elementary School PK-5 | 557 Students | 1.3 miles away | Not Yet Rated | |
| North Elementary School KG-5 | 223 Students | 1.4 miles away | 5 out of 5 | |
| Stevenson Elementary School PK-8 | 952 Students | 1.4 miles away | 5 out of 5 | |
| Jane Addams Elementary School KG-8 | 455 Students | 1.5 miles away | 5 out of 5 | |
| Early Childhood Center School PK-KG | 270 Students | 1.6 miles away | Not Yet Rated | - |
| Elmwood Elementary School 1-6 | 522 Students | 1.7 miles away | Not Yet Rated | |
| John Mills Elementary School 1-6 | 638 Students | 1.7 miles away | 5 out of 5 | |
Compare This School To Nearby Schools ->
School Community Forum

Join a discussion about Rhodes Elementary School and talk to others in the community including students, parents, teachers, and administrators.
Popular Discussion Topics
- Admissions and Registration Questions (e.g. Dress Code and Discipline Policy)
- School Calendar and Upcoming Events (e.g. Graduation)
- After School Programs, Extracurricular Activities, and Athletics (e.g. Football)
- News and Announcements (e.g. Yearbook and Class Supply List Details)
- Graduate and Alumni Events (e.g. Organizing Class Reunions)
Navigation
Can't Find What You Are Looking For?
Rankings
Nearby Cities
Sponsored Links
K-12 Articles

Teaching Children a Love of History
Parents and grandparents are responsible for teaching children a love of history. To begin, relate...
Parents and grandparents are responsible for teaching children a love of history. To begin, relate...

It's the Most Wonderful Time of the Year!
For most of the country, school is starting up this week or later this month-at the beginning of...
For most of the country, school is starting up this week or later this month-at the beginning of...

Bullies... What Are They Good For?
Bullies have been around since the beginning of time. We had to deal with bullies, and our parents...
Bullies have been around since the beginning of time. We had to deal with bullies, and our parents...