Arleta High School

3 out of 5 | 2 Reviews
Find Old Friends From Arleta High School
Use the form below to search for alumni from Arleta High School.
School Description
School Summary and Highlights
- Enrolls 1,978 middle and high school students from grades 6-12
- Ranks 1115th out of 1,197 high schools in CA.
- 2010 Overall School AYP Met Status: No
Additional Contact Information
- Mailing Address: 14200 Van Nuys Blvd., Arleta, CA 91331
School Operational Details
- Title I EligibleAll students of this school are eligible for participation in authorized programs.
School District Details
- Los Angeles Unified School District
- Per-Pupil Spending: $11,357
- Graduation Rate: 48.8%
- Dropout Rate: 6.8%
- Students Per Teacher: 21.3
- Enrolled Students: 667,870
Faculty Details and Student Enrollment
Students and Faculty
- Total Students Enrolled: 1,978
- Total Full Time "Equivalent" Teachers: 75.6
- Average Student-To-Teacher Ratio: 26.2
Students Gender Breakdown
- Males: 1,054 (53.3%)
- Females: 924 (46.7%)
Free Lunch Student Eligibility Breakdown
- Eligible for Reduced Lunch: 170 (8.6%)
- Eligible for Free Lunch: 1,500 (75.8%)
- Eligible for Either Reduced or Free Lunch: 1,670 (84.4%)
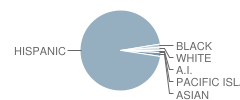
Student Enrollment Distribution by Race / Ethnicity

| Number | Percent | |
|---|---|---|
| American Indian | 16 | 0.8% |
| Black | 25 | 1.3% |
| Asian | 30 | 1.5% |
| Hispanic | 1,869 | 94.5% |
| White | 27 | 1.4% |
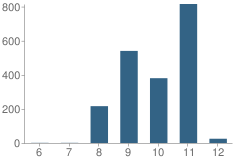
Number of Students Per Grade

| Number | Percent | |
|---|---|---|
| 6th Grade | 1 | 0.05% |
| 7th Grade | 1 | 0.05% |
| 8th Grade | 216 | 10.9% |
| 9th Grade | 540 | 27.3% |
| 10th Grade | 380 | 19.2% |
| 11th Grade | 815 | 41.2% |
| 12th Grade | 25 | 1.3% |
Graduates Information (2010)
Graduation Rate
School:
86.0%
District:
69.1%
State:
78.6%
Teacher Education Background (2009)
Percent With Ph.D.
School:
4.7%
District:
3.7%
Percent With Master's Degree
School:
12.8%
District:
26.9%
Percent With Bachelor's Degree
School:
26.7%
District:
31.9%
Teacher Credentials & Experience (2009)
Percent of Teachers With Credentials: 97.3%
Number of Certificated Staff: 86.0
Average Number of Years of Teacher Experience: 7.6
Average Age
School:
40.2
District:
46.7
Source: CA Department of Education, Source: NCES 2009-2010
Sponsored Links
Test Scores and Performance Information
Overall School Rating
How is this determined?
The overall school rating shows that Arleta High School performed on average much worse than most other schools across the state on CST state exams in the following subjects:
- CST Algebra I
- CST Algebra II
- CST Biology
- CST Chemistry
- CST English-Language Arts
- CST Geometry
- CST Integrated/Coordinated Science
- CST Science
- CST Summative High School Math
- CST U.S. History
- CST World History
AYP Results (2010)
Overall AYP Met: No
ELA AYP Met: No
Math AYP Met: No
Program Improvement (PI) Requirement Under NCLB (2010)
First Year PI Requirement was Implemented: 2008-2009
School's Placement Under NCLB: Year 3
ACT Exam Results (2009)
Percent of Students Taking ACT Exam: 31.9%
Average Combined Score: 16.5
Percent Scoring At or Above 21: 8.1%
SAT Exam Results (2009)
Percent of Students Taking SAT Exam: 50.0%
Average Combined Score: 1,176.7
Critical Reading Average: 396.6
Math Average: 387.8
Writing Average: 392.4
Percent Scoring At or Above 1500: 6.9%
CST - Test Proficiency by Grade and Subject
Grade 9 - % of students at or above proficiency
| School | District | State | |
|---|---|---|---|
| CST Algebra I Test | |||
| 2010 | 12.0% | 11.0% | 22.0% |
| 2009 | 11.0% | 10.0% | 21.0% |
| 2008 | 4.0% | 9.0% | 18.0% |
| CST Biology Test | |||
| 2010 | 11.0% | 27.0% | 55.0% |
| 2009 | - | - | - |
| 2008 | 4.0% | 25.0% | 52.0% |
| CST English-Language Arts Test | |||
| 2010 | 31.0% | 36.0% | 54.0% |
| 2009 | 25.0% | 32.0% | 50.0% |
| 2008 | 30.0% | 31.0% | 49.0% |
| CST Geometry Test | |||
| 2010 | 10.0% | 21.0% | 46.0% |
| 2009 | 9.0% | 23.0% | 47.0% |
| 2008 | 10.0% | 19.0% | 43.0% |
| CST Integrated/Coordinated Science Test | |||
| 2010 | 8.0% | 13.0% | 19.0% |
| 2009 | 6.0% | 9.0% | 15.0% |
| CST World History Test | |||
| 2010 | 8.0% | 21.0% | 45.0% |
| 2009 | - | - | - |
| 2008 | 4.0% | 15.0% | 36.0% |
Grade 10 - % of students at or above proficiency
| School | District | State | |
|---|---|---|---|
| CST Algebra I Test | |||
| 2010 | 3.0% | 8.0% | 12.0% |
| CST Algebra II Test | |||
| 2010 | 6.0% | 21.0% | 40.0% |
| 2009 | 8.0% | 18.0% | 37.0% |
| 2008 | 9.0% | 17.0% | 36.0% |
| CST Biology Test | |||
| 2010 | 25.0% | 29.0% | 38.0% |
| 2009 | 15.0% | 24.0% | 34.0% |
| 2008 | 19.0% | 23.0% | 35.0% |
| CST English-Language Arts Test | |||
| 2010 | 27.0% | 33.0% | 45.0% |
| 2009 | 28.0% | 31.0% | 44.0% |
| 2008 | 22.0% | 29.0% | 41.0% |
| CST Geometry Test | |||
| 2010 | 3.0% | 6.0% | 14.0% |
| 2009 | 2.0% | 6.0% | 14.0% |
| 2008 | 1.0% | 5.0% | 12.0% |
| CST Science Test | |||
| 2010 | 32.0% | 32.0% | 46.0% |
| 2009 | 25.0% | 30.0% | 44.0% |
| 2008 | 18.0% | 25.0% | 40.0% |
| CST World History Test | |||
| 2010 | 20.0% | 28.0% | 42.0% |
| 2009 | 20.0% | 24.0% | 38.0% |
| 2008 | 20.0% | 19.0% | 33.0% |
| CST Chemistry Test | |||
| 2008 | 3.0% | 13.0% | 41.0% |
Grade 11 - % of students at or above proficiency
| School | District | State | |
|---|---|---|---|
| CST Algebra I Test | |||
| 2010 | 4.0% | 6.0% | 8.0% |
| CST Biology Test | |||
| 2010 | 5.0% | 29.0% | 46.0% |
| CST Chemistry Test | |||
| 2010 | 3.0% | 15.0% | 30.0% |
| 2009 | 1.0% | 13.0% | 27.0% |
| 2008 | 3.0% | 11.0% | 25.0% |
| CST English-Language Arts Test | |||
| 2010 | 24.0% | 34.0% | 42.0% |
| 2009 | 15.0% | 32.0% | 40.0% |
| 2008 | 14.0% | 27.0% | 37.0% |
| CST Geometry Test | |||
| 2010 | 2.0% | 3.0% | 6.0% |
| 2009 | - | - | - |
| 2008 | 1.0% | 2.0% | 6.0% |
| CST Summative High School Math Test | |||
| 2010 | 19.0% | 31.0% | 50.0% |
| 2009 | 6.0% | 27.0% | 47.0% |
| 2008 | 13.0% | 25.0% | 43.0% |
| CST U.S. History Test | |||
| 2010 | 27.0% | 33.0% | 45.0% |
| 2009 | 20.0% | 31.0% | 44.0% |
| 2008 | 15.0% | 25.0% | 38.0% |
| CST World History Test | |||
| 2010 | 12.0% | 14.0% | 15.0% |
| CST Algebra II Test | |||
| 2008 | 3.0% | 5.0% | 11.0% |
End of Course - % of students at or above proficiency
| School | District | State | |
|---|---|---|---|
| CST Algebra I Test | |||
| 2010 | 11.0% | 22.0% | 31.0% |
| 2009 | 10.0% | 19.0% | 28.0% |
| 2008 | 3.0% | 17.0% | 25.0% |
| CST Algebra II Test | |||
| 2010 | 1.0% | 16.0% | 31.0% |
| 2009 | 2.0% | 15.0% | 28.0% |
| 2008 | 5.0% | 13.0% | 27.0% |
| CST Biology Test | |||
| 2010 | 22.0% | 28.0% | 46.0% |
| 2009 | 14.0% | 24.0% | 42.0% |
| 2008 | 17.0% | 24.0% | 42.0% |
| CST Chemistry Test | |||
| 2010 | 3.0% | 16.0% | 38.0% |
| 2009 | 1.0% | 14.0% | 36.0% |
| 2008 | 3.0% | 12.0% | 32.0% |
| CST Geometry Test | |||
| 2010 | 5.0% | 14.0% | 27.0% |
| 2009 | 2.0% | 14.0% | 26.0% |
| 2008 | 2.0% | 11.0% | 24.0% |
| CST Integrated/Coordinated Science Test | |||
| 2010 | 8.0% | 3.0% | 16.0% |
| 2009 | 6.0% | 7.0% | 13.0% |
| CST Summative High School Math Test | |||
| 2010 | 20.0% | 35.0% | 54.0% |
| 2009 | 6.0% | 30.0% | 50.0% |
| 2008 | 18.0% | 29.0% | 47.0% |
| CST World History Test | |||
| 2010 | 18.0% | 27.0% | 41.0% |
| 2009 | 19.0% | 23.0% | 38.0% |
| 2008 | 18.0% | 18.0% | 33.0% |
Source: CA Department of Education 2009-2010
School Map and Similar Schools Nearby
Click to Activate Map of Nearby School Campuses
Private
Public
This School
Similar Schools Nearby
| San Fernando High School 9-12 | 3,254 Students | 1.4 miles away | Not Yet Rated | |
| James Monroe High School 9-12 | 2,749 Students | 2.1 miles away | ![]() 4.5 out of 5 | |
| Panorama High School 9-11 | 2,361 Students | 2.4 miles away | Not Yet Rated | |
| Sun Valley High School 9-12 | 986 Students | 2.8 miles away | Not Yet Rated | - |
| John H. Francis Polytechnic School 9-12 | 3,139 Students | 3.0 miles away | ![]() 1 out of 5 | |
| John F. Kennedy High School 9-12 | 3,159 Students | 3.1 miles away | ![]() 5 out of 5 | |
| Robert Fulton College Preparatory School 6-12 | 1,910 Students | 3.2 miles away | Not Yet Rated | |
| Sylmar High School 9-12 | 3,625 Students | 3.9 miles away | ![]() 5 out of 5 | |
| Van Nuys High School 9-12 | 3,055 Students | 4.3 miles away | Not Yet Rated | |
| Northridge Academy High 9-12 | 1,061 Students | 4.6 miles away | ![]() 2 out of 5 | |
Compare This School To Nearby Schools ->
School Community Forum

Join a discussion about Arleta High School and talk to others in the community including students, parents, teachers, and administrators.
Popular Discussion Topics
- Admissions and Registration Questions (e.g. Dress Code and Discipline Policy)
- School Calendar and Upcoming Events (e.g. Graduation)
- After School Programs, Extracurricular Activities, and Athletics (e.g. Football)
- News and Announcements (e.g. Yearbook and Class Supply List Details)
- Graduate and Alumni Events (e.g. Organizing Class Reunions)
Navigation
Can't Find What You Are Looking For?
Rankings
Nearby Cities
Sponsored Links
K-12 Articles
Is Your Child Happy at School?
As a parent, you'd love to have your child share all of his feelings with you. It would be so easy...
Keep Morning Stress at a Minimum: Establish a Routine
Morning! It can be a time of stress. The kids are fighting over who gets to use the bathroom first,...
Summer Safety Tips to Keep Kids Safe
It won't be long until kids run from the school, shrieking in delight because they're free for the...


(5 / 5)
(1 / 5) 


