Arts and Technology Academy at Jefferson
Rating
Not Available
Not Available

No Reviews Yet
Find Old Friends From Arts and Technology Academy at Jefferson
Use the form below to search for alumni from Arts and Technology Academy at Jefferson.
School Description
School Summary and Highlights
- Enrolls 392 elementary school students from grades KG-8
- Ranks 112th out of 360 middle schools in OR.
Additional Contact Information
- Mailing Address: 1650 W 22nd Ave, Eugene, OR 97405
School Operational Details
- Title I Eligible
School District Details
- Eugene School District 4j
- Per-Pupil Spending: $9,819
- Graduation Rate: 87.6%
- Dropout Rate: 2.1%
- Students Per Teacher: 20.7
- Enrolled Students: 17,175
Faculty Details and Student Enrollment
Students and Faculty
- Total Students Enrolled: 392
- Total Full Time "Equivalent" Teachers: 20.3
- Average Student-To-Teacher Ratio: 19.3
Students Gender Breakdown
- Males: 215 (54.8%)
- Females: 147 (37.5%)
Free Lunch Student Eligibility Breakdown
- Eligible for Reduced Lunch: 38 (9.7%)
- Eligible for Free Lunch: 210 (53.6%)
- Eligible for Either Reduced or Free Lunch: 248 (63.3%)
Student Enrollment Distribution by Race / Ethnicity
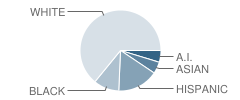
| Number | Percent | |
|---|---|---|
| American Indian | 17 | 4.3% |
| Black | 37 | 9.4% |
| Asian | 17 | 4.3% |
| Hispanic | 59 | 15.1% |
| White | 232 | 59.2% |
Number of Students Per Grade
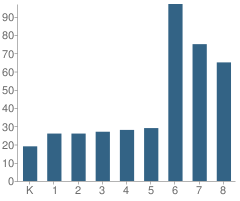
| Number | Percent | |
|---|---|---|
| Kindergarten | 19 | 4.8% |
| 1st Grade | 26 | 6.6% |
| 2nd Grade | 26 | 6.6% |
| 3rd Grade | 27 | 6.9% |
| 4th Grade | 28 | 7.1% |
| 5th Grade | 29 | 7.4% |
| 6th Grade | 97 | 24.7% |
| 7th Grade | 75 | 19.1% |
| 8th Grade | 65 | 16.6% |
Source: OR Department of Education, Source: NCES 2009-2010
School Ratings and Reviews
Be The First To Review Arts and Technology Academy at Jefferson!
School Map and Similar Schools Nearby
Click to Activate Map of Nearby School Campuses
Private
Public
This School
Similar Schools Nearby
| Adams Elementary School KG-5 | 191 Students | 0.5 miles away | Not Yet Rated | |
| Cesar E Chavez Elementary School KG-5 | 458 Students | 0.6 miles away | Not Yet Rated | |
| Mccornack Elementary School KG-5 | 416 Students | 1.4 miles away | Not Yet Rated | |
| Crest Drive Elementary School KG-5 | 262 Students | 1.4 miles away | Not Yet Rated | |
| Camas Ridge Community Elementary School KG-5 | 279 Students | 2.2 miles away | Not Yet Rated | |
| Edison Elementary School KG-5 | 320 Students | 2.2 miles away | Not Yet Rated | |
| Willagillespie Elementary School KG-5 | 371 Students | 2.6 miles away | Not Yet Rated | |
| Ellis Parker Elementary School KG-5 | 265 Students | 2.6 miles away |  5 out of 5 | |
| Edgewood Elementary School KG-5 | 306 Students | 2.7 miles away | Not Yet Rated | |
| Fairfield Elementary School KG-5 | 316 Students | 2.9 miles away | Not Yet Rated | |
Compare This School To Nearby Schools ->
School Community Forum

Join a discussion about Arts and Technology Academy at Jefferson and talk to others in the community including students, parents, teachers, and administrators.
Popular Discussion Topics
- Admissions and Registration Questions (e.g. Dress Code and Discipline Policy)
- School Calendar and Upcoming Events (e.g. Graduation)
- After School Programs, Extracurricular Activities, and Athletics (e.g. Football)
- News and Announcements (e.g. Yearbook and Class Supply List Details)
- Graduate and Alumni Events (e.g. Organizing Class Reunions)
Navigation
Can't Find What You Are Looking For?
Nearby Cities
Sponsored Links
K-12 Articles

The Impact on Adopted Children at School
Children who are adopted can be affected both academically and socially at school. Many times...
Children who are adopted can be affected both academically and socially at school. Many times...

Is Your Child Happy at School?
As a parent, you'd love to have your child share all of his feelings with you. It would be so easy...
As a parent, you'd love to have your child share all of his feelings with you. It would be so easy...

Keep Morning Stress at a Minimum: Establish a Routine
Morning! It can be a time of stress. The kids are fighting over who gets to use the bathroom first,...
Morning! It can be a time of stress. The kids are fighting over who gets to use the bathroom first,...