Durham Center School
Rating
Not Available
Not Available

No Reviews Yet
Find Old Friends From Durham Center School
Use the form below to search for alumni from Durham Center School.
School Description
School Summary and Highlights
- Enrolls 63 middle and high school students from grades 6-12
School Operational Details
- Alternative School
School District Details
- Tigard-Tualatin School District 23j
- Per-Pupil Spending: $8,670
- Graduation Rate: 82.6%
- Dropout Rate: 2.8%
- Students Per Teacher: 21.4
- Enrolled Students: 12,611
Faculty Details and Student Enrollment
Students and Faculty
- Total Students Enrolled: 63
- Total Full Time "Equivalent" Teachers: 6.3
- Average Student-To-Teacher Ratio: 10.1
Students Gender Breakdown
- Males: 26 (41.3%)
- Females: 34 (54.0%)
Student Enrollment Distribution by Race / Ethnicity
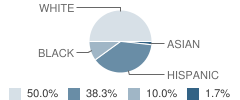
| Number | Percent | |
|---|---|---|
| American Indian | - | - |
| Black | 6 | 9.5% |
| Asian | 1 | 1.6% |
| Hispanic | 23 | 36.5% |
| White | 30 | 47.6% |
Number of Students Per Grade
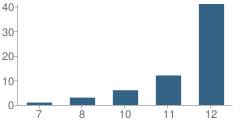
| Number | Percent | |
|---|---|---|
| 7th Grade | 1 | 1.6% |
| 8th Grade | 3 | 4.8% |
| 10th Grade | 6 | 9.5% |
| 11th Grade | 12 | 19.0% |
| 12th Grade | 41 | 65.1% |
Source: OR Department of Education, Source: NCES 2009-2010
School Ratings and Reviews
Be The First To Review Durham Center School!
School Map and Similar Schools Nearby
Click to Activate Map of Nearby School Campuses
Private
Public
This School
Similar Schools Nearby
| Milwaukie Eschool 9-12 | 22 Students | 6.5 miles away | Not Yet Rated | |
| Town Center School PK-12 | 72 Students | 6.9 miles away | Not Yet Rated | |
| Merlo Station Night School 10-12 | 75 Students | 8.2 miles away | Not Yet Rated | - |
| Metropolitan Learning Center School KG-12 | 443 Students | 9.1 miles away | Not Yet Rated | |
Compare This School To Nearby Schools ->
Navigation
Can't Find What You Are Looking For?
Nearby Cities
Sponsored Links
K-12 Articles

Teachers Packing Heat
After the recent school shootings (and thwarted school shootings) in the past month-just as after...
After the recent school shootings (and thwarted school shootings) in the past month-just as after...

Cut the Credit and Save You Some Money
Today’s society glorifies a get-it-now mentality. Children learn this early. You probably noticed...
Today’s society glorifies a get-it-now mentality. Children learn this early. You probably noticed...

Strategies to Help Kids Cope with Stress
Many parents believe that kids don’t experience stress. Nothing could be further from the truth....
Many parents believe that kids don’t experience stress. Nothing could be further from the truth....