Valley Head High School
Rating
Not Available
Not Available

4 out of 5 | 5 Reviews
Find Old Friends From Valley Head High School
Use the form below to search for alumni from Valley Head High School.
School Description
School Summary and Highlights
- Enrolls 509 elementary, middle, and high school students from grades KG-12
- Ranks 211th out of 357 high schools in AL.
Additional Contact Information
- Mailing Address: P O Box 145, Valley Head, AL 35989
- Principal or Admin: Mr William T Monroe
- Fax: (256) 635-6229
- Website: www.dekalbk12.org
School Operational Details
- Title I EligibleAll students of this school are eligible for participation in authorized programs.
- Shared Time School
School District Details
- Dekalb County School District
- Per-Pupil Spending: $8,929
- Graduation Rate: 67.7%
- Dropout Rate: 1.0%
- Students Per Teacher: 14.9
- Enrolled Students: 8,881
Faculty Details and Student Enrollment
Students and Faculty
- Total Students Enrolled: 509
- Total Full Time "Equivalent" Teachers: 44.8
- Average Student-To-Teacher Ratio: 11.4
Students Gender Breakdown
- Males: 263 (51.7%)
- Females: 246 (48.3%)
Free Lunch Student Eligibility Breakdown
- Eligible for Reduced Lunch: 54 (10.6%)
- Eligible for Free Lunch: 348 (68.4%)
- Eligible for Either Reduced or Free Lunch: 402 (79.0%)
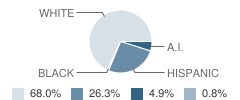
Student Enrollment Distribution by Race / Ethnicity
| Number | Percent | |
|---|---|---|
| American Indian | 25 | 4.9% |
| Black | 4 | 0.8% |
| Asian | - | - |
| Hispanic | 134 | 26.3% |
| White | 346 | 68.0% |
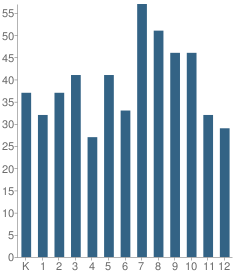
Number of Students Per Grade
| Number | Percent | |
|---|---|---|
| Kindergarten | 37 | 7.3% |
| 1st Grade | 32 | 6.3% |
| 2nd Grade | 37 | 7.3% |
| 3rd Grade | 41 | 8.1% |
| 4th Grade | 27 | 5.3% |
| 5th Grade | 41 | 8.1% |
| 6th Grade | 33 | 6.5% |
| 7th Grade | 57 | 11.2% |
| 8th Grade | 51 | 10.0% |
| 9th Grade | 46 | 9.0% |
| 10th Grade | 46 | 9.0% |
| 11th Grade | 32 | 6.3% |
| 12th Grade | 29 | 5.7% |
Source: AL Department of Education, Source: NCES 2009-2010
School Ratings and Reviews
Overall Rating: 4

4 out of 5 | 5 Reviews
The Overall Rating is the school's average rating from parents, students, school faculty and staff. The highest rating is five apples and the lowest is one apple.
Share Your Review About This School
5 reviews for Valley Head High School
- Reviewed by Parent or Guardian on January 04, 2012
- Rating:
 (5 / 5) Flag as inappropriate
 - Valley head is one of the best schools around. i've been going here since i was in the fifth grade.
- Reviewed by Student on January 27, 2011
- Rating: (5 / 5) Flag as inappropriate
- how do you talk too a consler
- Reviewed by Student on July 20, 2010
- Rating: (5 / 5) Flag as inappropriate
- i love u guys 4 eva i hoope ill come next year in 7th grade love katie pester as someof u say
- Reviewed by Parent/Guardian on June 11, 2010
- Rating:
 (1 / 5) Flag as inappropriate
 - The principals Bill Monroe & Coach Kirby do not care about anybody at that school if they are not a sports figure. The teachers are the same except for Sandra Hulgan Linsey Freeman & Ana Murphrey. I as a parent feel as if Pamlyn Wooten should not have been fired and should be rehired. she truly cared about the kids school work. While Coach Britt sat in his chair on the computer or in the field house leaving the kids for pam to tend 2. So i advise parents to not send there children to valley head high school unless they do some serious changing.
- Reviewed by Parent/Guardian on March 30, 2010
- Rating: (5 / 5) Flag as inappropriate
- I'm trying to order a FFA shirt for Autumn, and they are asking for your FFA chapter number. Can any one help me?
Thanks,
Grandpa Corser
School Map and Similar Schools Nearby
Click to Activate Map of Nearby School Campuses
Private
Public
This School
Similar Schools Nearby
| Fort Payne High School 9-12 | 828 Students | 6.4 miles away |  1 out of 5 | |
| Ider School KG-12 | 808 Students | 10.7 miles away | Not Yet Rated | |
| Sylvania School KG-12 | 979 Students | 11.3 miles away | Not Yet Rated | |
| Plainview School KG-12 | 1,239 Students | 13.0 miles away |  5 out of 5 | |
| Pisgah High School KG-12 | 635 Students | 15.5 miles away | Not Yet Rated | |
| Ruhuma Junior High School KG-8 | 195 Students | 16.0 miles away | Not Yet Rated | |
| Fyffe High School KG-12 | 962 Students | 18.3 miles away | 5 out of 5 | |
| North Sand Mountain School KG-12 | 704 Students | 20.1 miles away | 5 out of 5 | |
| Gaylesville High School PK-12 | 405 Students | 20.5 miles away | 5 out of 5 | |
| Section High School KG-12 | 553 Students | 20.9 miles away | Not Yet Rated | |
Compare This School To Nearby Schools ->
School Community Forum

Join a discussion about Valley Head High School and talk to others in the community including students, parents, teachers, and administrators.
Popular Discussion Topics
- Admissions and Registration Questions (e.g. Dress Code and Discipline Policy)
- School Calendar and Upcoming Events (e.g. Graduation)
- After School Programs, Extracurricular Activities, and Athletics (e.g. Football)
- News and Announcements (e.g. Yearbook and Class Supply List Details)
- Graduate and Alumni Events (e.g. Organizing Class Reunions)
Navigation
Can't Find What You Are Looking For?
Nearby Cities
Sponsored Links
K-12 Articles

Cutting Class
Depression is a very real problem for today's youth. When your spirit doesn't feel good, a lot of...
Depression is a very real problem for today's youth. When your spirit doesn't feel good, a lot of...

Choosing a Summer Camp for Your Child
Are you planning to send your child to summer camp this year? If so, have you taken his needs into...
Are you planning to send your child to summer camp this year? If so, have you taken his needs into...

The First Day of School
The first day of kindergarten is a rite of passage for any student. Every mother cries and...
The first day of kindergarten is a rite of passage for any student. Every mother cries and...