Amador Valley High School

No Reviews Yet
Find Old Friends From Amador Valley High School
Use the form below to search for alumni from Amador Valley High School.
School Description
School Summary and Highlights
- Enrolls 2,591 high school students from grades 9-12
- Ranks 115th out of 1,197 high schools in CA.
- 2010 Overall School AYP Met Status: Yes
- National Blue Ribbon Schools Award 2006

Additional Contact Information
- Mailing Address: 1155 Santa Rita Rd., Pleasanton, CA 94566
School District Details
- Pleasanton Unified School District
- Per-Pupil Spending: $9,235
- Graduation Rate: 99.9%
- Dropout Rate: 0.4%
- Students Per Teacher: 22.6
- Enrolled Students: 14,804
Faculty Details and Student Enrollment
Students and Faculty
- Total Students Enrolled: 2,591
- Total Full Time "Equivalent" Teachers: 108.6
- Average Student-To-Teacher Ratio: 23.9
Students Gender Breakdown
- Males: 1,291 (49.8%)
- Females: 1,300 (50.2%)
Free Lunch Student Eligibility Breakdown
- Eligible for Reduced Lunch: 21 (0.8%)
- Eligible for Free Lunch: 74 (2.9%)
- Eligible for Either Reduced or Free Lunch: 95 (3.7%)
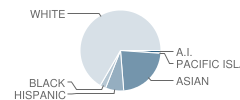
Student Enrollment Distribution by Race / Ethnicity

| Number | Percent | |
|---|---|---|
| American Indian | 27 | 1.0% |
| Black | 61 | 2.4% |
| Asian | 577 | 22.3% |
| Hispanic | 187 | 7.2% |
| White | 1,698 | 65.5% |
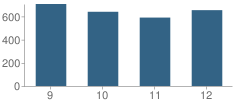
Number of Students Per Grade

| Number | Percent | |
|---|---|---|
| 9th Grade | 707 | 27.3% |
| 10th Grade | 640 | 24.7% |
| 11th Grade | 590 | 22.8% |
| 12th Grade | 654 | 25.2% |
Graduates Information (2010)
Graduation Rate
School:
99.1%
District:
96.4%
State:
78.6%
Teacher Education Background (2009)
Percent With Ph.D.
School:
78.7%
District:
4.2%
Percent With Master's Degree
School:
16.5%
District:
27.1%
Percent With Bachelor's Degree
School:
27.6%
District:
14.6%
Teacher Credentials & Experience (2009)
Percent of Teachers With Emergency Credentials: 0.9%
Percent of Teachers With Credentials: 96.5%
Number of Certificated Staff: 127.0
Average Number of Years of Teacher Experience: 9.7
Average Age
School:
39.4
District:
45.5
Source: CA Department of Education, Source: NCES 2009-2010
School Ratings and Reviews
Be The First To Review Amador Valley High School!
Sponsored Links
Test Scores and Performance Information
Overall School Rating
How is this determined?
The overall school rating shows that Amador Valley High School performed on average better than many other schools across the state on CST state exams in the following subjects:
- CST Algebra I
- CST Algebra II
- CST Biology
- CST Chemistry
- CST English-Language Arts
- CST General Mathematics
- CST Geometry
- CST Integrated/Coordinated Science
- CST Physics
- CST Science
- CST Summative High School Math
- CST U.S. History
- CST World History
AYP Results (2010)
Overall AYP Met: Yes
ELA AYP Met: Yes
Math AYP Met: Yes
ACT Exam Results (2009)
Percent of Students Taking ACT Exam: 30.0%
Average Combined Score: 25.3
Percent Scoring At or Above 21: 87.6%
SAT Exam Results (2009)
Percent of Students Taking SAT Exam: 75.1%
Average Combined Score: 1,710.5
Critical Reading Average: 564.4
Math Average: 588.9
Writing Average: 557.2
Percent Scoring At or Above 1500: 76.6%
CST - Test Proficiency by Grade and Subject
Grade 9 - % of students at or above proficiency
| School | District | State | |
|---|---|---|---|
| CST Algebra I Test | |||
| 2010 | 32.0% | 35.0% | 22.0% |
| 2009 | 40.0% | 41.0% | 21.0% |
| 2008 | 35.0% | 35.0% | 18.0% |
| CST Algebra II Test | |||
| 2010 | 97.0% | 96.0% | 69.0% |
| 2009 | 96.0% | 97.0% | 65.0% |
| 2008 | 75.0% | 84.0% | 66.0% |
| CST Biology Test | |||
| 2010 | 94.0% | 92.0% | 55.0% |
| 2009 | 96.0% | 95.0% | 51.0% |
| 2008 | 96.0% | 91.0% | 52.0% |
| CST English-Language Arts Test | |||
| 2010 | 86.0% | 85.0% | 54.0% |
| 2009 | 85.0% | 85.0% | 50.0% |
| 2008 | 82.0% | 83.0% | 49.0% |
| CST General Mathematics Test | |||
| 2010 | 4.0% | 2.0% | 17.0% |
| CST Geometry Test | |||
| 2010 | 81.0% | 75.0% | 46.0% |
| 2009 | 85.0% | 80.0% | 47.0% |
| 2008 | 69.0% | 69.0% | 43.0% |
| CST Physics Test | |||
| 2010 | 38.0% | 34.0% | 40.0% |
| 2009 | 32.0% | 23.0% | 35.0% |
| 2008 | 47.0% | 48.0% | 30.0% |
Grade 10 - % of students at or above proficiency
| School | District | State | |
|---|---|---|---|
| CST Algebra I Test | |||
| 2010 | 19.0% | 12.0% | 12.0% |
| 2009 | - | - | - |
| 2008 | 2.0% | 4.0% | 9.0% |
| CST Algebra II Test | |||
| 2010 | 62.0% | 64.0% | 40.0% |
| 2009 | 66.0% | 59.0% | 37.0% |
| 2008 | 55.0% | 56.0% | 36.0% |
| CST Biology Test | |||
| 2010 | 81.0% | 74.0% | 38.0% |
| 2009 | 73.0% | 71.0% | 34.0% |
| 2008 | 79.0% | 71.0% | 35.0% |
| CST Chemistry Test | |||
| 2010 | 78.0% | 79.0% | 47.0% |
| 2009 | 73.0% | 78.0% | 44.0% |
| 2008 | 80.0% | 82.0% | 41.0% |
| CST English-Language Arts Test | |||
| 2010 | 81.0% | 79.0% | 45.0% |
| 2009 | 77.0% | 77.0% | 44.0% |
| 2008 | 78.0% | 76.0% | 41.0% |
| CST Geometry Test | |||
| 2010 | 28.0% | 19.0% | 14.0% |
| 2009 | 26.0% | 23.0% | 14.0% |
| 2008 | 18.0% | 16.0% | 12.0% |
| CST Physics Test | |||
| 2010 | 100.0% | 98.0% | 44.0% |
| 2009 | - | - | - |
| 2008 | 94.0% | 96.0% | 36.0% |
| CST Science Test | |||
| 2010 | 83.0% | 82.0% | 46.0% |
| 2009 | 82.0% | 79.0% | 44.0% |
| 2008 | 78.0% | 78.0% | 40.0% |
| CST Summative High School Math Test | |||
| 2010 | 90.0% | 93.0% | 75.0% |
| 2009 | 87.0% | 92.0% | 71.0% |
| 2008 | 81.0% | 85.0% | 68.0% |
| CST World History Test | |||
| 2010 | 78.0% | 76.0% | 42.0% |
| 2009 | 76.0% | 76.0% | 38.0% |
| 2008 | 74.0% | 72.0% | 33.0% |
| CST Integrated/Coordinated Science Test | |||
| 2008 | 7.0% | 6.0% | 7.0% |
Grade 11 - % of students at or above proficiency
| School | District | State | |
|---|---|---|---|
| CST Algebra II Test | |||
| 2010 | 13.0% | 16.0% | 14.0% |
| 2009 | 15.0% | 14.0% | 12.0% |
| 2008 | 10.0% | 14.0% | 11.0% |
| CST Biology Test | |||
| 2010 | 84.0% | 71.0% | 46.0% |
| 2009 | 74.0% | 73.0% | 41.0% |
| 2008 | 80.0% | 68.0% | 39.0% |
| CST Chemistry Test | |||
| 2010 | 47.0% | 52.0% | 30.0% |
| 2009 | 46.0% | 51.0% | 27.0% |
| 2008 | 46.0% | 53.0% | 25.0% |
| CST English-Language Arts Test | |||
| 2010 | 76.0% | 74.0% | 42.0% |
| 2009 | 74.0% | 73.0% | 40.0% |
| 2008 | 68.0% | 70.0% | 37.0% |
| CST Geometry Test | |||
| 2010 | 5.0% | 5.0% | 6.0% |
| 2009 | 9.0% | 6.0% | 7.0% |
| 2008 | 12.0% | 4.0% | 6.0% |
| CST Integrated/Coordinated Science Test | |||
| 2010 | 15.0% | 21.0% | 8.0% |
| 2009 | 8.0% | 18.0% | 11.0% |
| 2008 | 8.0% | 13.0% | 10.0% |
| CST Physics Test | |||
| 2010 | 94.0% | 89.0% | 53.0% |
| 2009 | 88.0% | 83.0% | 50.0% |
| 2008 | 86.0% | 84.0% | 47.0% |
| CST Summative High School Math Test | |||
| 2010 | 69.0% | 73.0% | 50.0% |
| 2009 | 65.0% | 71.0% | 47.0% |
| 2008 | 55.0% | 67.0% | 43.0% |
| CST U.S. History Test | |||
| 2010 | 79.0% | 78.0% | 45.0% |
| 2009 | 78.0% | 79.0% | 44.0% |
| 2008 | 74.0% | 74.0% | 38.0% |
| CST Algebra I Test | |||
| 2009 | 7.0% | 8.0% | 8.0% |
| CST World History Test | |||
| 2008 | 15.0% | 19.0% | 9.0% |
End of Course - % of students at or above proficiency
| School | District | State | |
|---|---|---|---|
| CST Algebra I Test | |||
| 2010 | 29.0% | 61.0% | 31.0% |
| 2009 | 34.0% | 57.0% | 28.0% |
| 2008 | 30.0% | 56.0% | 25.0% |
| CST Algebra II Test | |||
| 2010 | 49.0% | 50.0% | 31.0% |
| 2009 | 48.0% | 43.0% | 28.0% |
| 2008 | 42.0% | 42.0% | 27.0% |
| CST Biology Test | |||
| 2010 | 87.0% | 81.0% | 46.0% |
| 2009 | 82.0% | 80.0% | 42.0% |
| 2008 | 86.0% | 79.0% | 42.0% |
| CST Chemistry Test | |||
| 2010 | 65.0% | 66.0% | 38.0% |
| 2009 | 60.0% | 65.0% | 36.0% |
| 2008 | 63.0% | 67.0% | 32.0% |
| CST General Mathematics Test | |||
| 2010 | 4.0% | 14.0% | 27.0% |
| CST Geometry Test | |||
| 2010 | 63.0% | 58.0% | 27.0% |
| 2009 | 61.0% | 59.0% | 26.0% |
| 2008 | 48.0% | 48.0% | 24.0% |
| CST Integrated/Coordinated Science Test | |||
| 2010 | 14.0% | 19.0% | 16.0% |
| 2009 | 7.0% | 17.0% | 13.0% |
| 2008 | 8.0% | 12.0% | 11.0% |
| CST Physics Test | |||
| 2010 | 70.0% | 72.0% | 49.0% |
| 2009 | 74.0% | 69.0% | 46.0% |
| 2008 | 79.0% | 82.0% | 43.0% |
| CST Summative High School Math Test | |||
| 2010 | 71.0% | 75.0% | 54.0% |
| 2009 | 67.0% | 72.0% | 50.0% |
| 2008 | 57.0% | 68.0% | 47.0% |
| CST World History Test | |||
| 2010 | 78.0% | 76.0% | 41.0% |
| 2009 | 74.0% | 74.0% | 38.0% |
| 2008 | 73.0% | 71.0% | 33.0% |
Source: CA Department of Education 2009-2010
School Map and Similar Schools Nearby
Click to Activate Map of Nearby School Campuses
Private
Public
This School
Similar Schools Nearby
| Foothill High School 9-12 | 2,281 Students | 2.5 miles away | ![]() 5 out of 5 | |
| Dublin High School 9-12 | 493 Students | 4.6 miles away | ![]() 5 out of 5 | |
| Granada High School 9-12 | 2,291 Students | 4.7 miles away | Not Yet Rated | |
| Livermore High School 9-12 | 2,058 Students | 6.2 miles away | Not Yet Rated | |
| California High School 9-12 | 2,431 Students | 6.8 miles away | Not Yet Rated | |
| Mission San Jose High School 9-12 | 2,150 Students | 9.1 miles away | Not Yet Rated | |
| William Hopkins Junior High School 7-8 | 1,105 Students | 9.2 miles away | ![]() 5 out of 5 | |
| James Logan High School 9-12 | 4,150 Students | 9.9 miles away | Not Yet Rated | |
| Centerville Junior High School 7-8 | 1,016 Students | 10.4 miles away | ![]() 4 out of 5 | |
| Washington High School 9-12 | 1,937 Students | 10.4 miles away | ![]() 5 out of 5 | |
Compare This School To Nearby Schools ->
School Community Forum

Join a discussion about Amador Valley High School and talk to others in the community including students, parents, teachers, and administrators.
Popular Discussion Topics
- Admissions and Registration Questions (e.g. Dress Code and Discipline Policy)
- School Calendar and Upcoming Events (e.g. Graduation)
- After School Programs, Extracurricular Activities, and Athletics (e.g. Football)
- News and Announcements (e.g. Yearbook and Class Supply List Details)
- Graduate and Alumni Events (e.g. Organizing Class Reunions)
Navigation
Can't Find What You Are Looking For?
Rankings
Nearby Cities
Sponsored Links
K-12 Articles
Help Your Child Achieve Success in Middle School
Middle school is for children between the ages of 10 and 14 years. At this time children begin to...
Tips for Purchasing Back to School Supplies
In just a few days, kids from all over the US will be going back to school. Now is the time to take...
Idle Hands
The worst affliction affecting our kids today is not teen pregnancy, drugs and alcohol, or...


