Caruthers High School

No Reviews Yet
Find Old Friends From Caruthers High School
Use the form below to search for alumni from Caruthers High School.
School Description
School Summary and Highlights
- Enrolls 539 high school students from grades 9-12
- Ranks 677th out of 1,197 high schools in CA.
- 2010 Overall School AYP Met Status: No
Additional Contact Information
- Mailing Address: PO Box 545, Caruthers, CA 93609
School Operational Details
- Title I EligibleAll students of this school are eligible for participation in authorized programs.
School District Details
- Caruthers Unified School District
- Per-Pupil Spending: $9,582
- Graduation Rate: 90.3%
- Dropout Rate: 2.1%
- Students Per Teacher: 18.4
- Enrolled Students: 1,340
Faculty Details and Student Enrollment
Students and Faculty
- Total Students Enrolled: 539
- Total Full Time "Equivalent" Teachers: 32.0
- Average Student-To-Teacher Ratio: 16.8
Students Gender Breakdown
- Males: 273 (50.6%)
- Females: 266 (49.4%)
Free Lunch Student Eligibility Breakdown
- Eligible for Reduced Lunch: 41 (7.6%)
- Eligible for Free Lunch: 439 (81.4%)
- Eligible for Either Reduced or Free Lunch: 480 (89.1%)
Student Enrollment Distribution by Race / Ethnicity
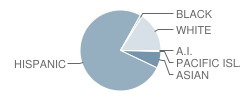
| Number | Percent | |
|---|---|---|
| American Indian | 1 | 0.2% |
| Black | 5 | 0.9% |
| Asian | 36 | 6.7% |
| Hispanic | 409 | 75.9% |
| White | 86 | 16.0% |
Number of Students Per Grade
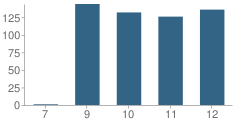
| Number | Percent | |
|---|---|---|
| 7th Grade | 1 | 0.2% |
| 9th Grade | 144 | 26.7% |
| 10th Grade | 132 | 24.5% |
| 11th Grade | 126 | 23.4% |
| 12th Grade | 136 | 25.2% |
Graduates Information (2010)
Graduation Rate
School:
92.1%
District:
88.6%
State:
78.6%
Teacher Education Background (2009)
Percent With Ph.D.: 2.7%
Percent With Master's Degree
School:
16.2%
District:
66.7%
Percent With Bachelor's Degree: 21.6%
Teacher Credentials & Experience (2009)
Percent of Teachers With Credentials: 93.9%
Number of Certificated Staff: 37.0
Average Number of Years of Teacher Experience: 8.7
Average Age
School:
36.1
District:
51.3
Source: CA Department of Education, Source: NCES 2009-2010
School Ratings and Reviews
Be The First To Review Caruthers High School!
Sponsored Links
Test Scores and Performance Information
Overall School Rating
How is this determined?
The overall school rating shows that Caruthers High School performed on average about the same as other schools across the state on CST state exams in the following subjects:
- CST Algebra I
- CST Algebra II
- CST Biology
- CST Chemistry
- CST English-Language Arts
- CST Geometry
- CST Integrated/Coordinated Science
- CST Science
- CST Summative High School Math
- CST U.S. History
- CST World History
AYP Results (2010)
Overall AYP Met: No
ELA AYP Met: No
Math AYP Met: Yes
Program Improvement (PI) Requirement Under NCLB (2010)
First Year PI Requirement was Implemented: 2009-2010
School's Placement Under NCLB: Year 2
ACT Exam Results (2009)
Percent of Students Taking ACT Exam: 7.0%
SAT Exam Results (2009)
Percent of Students Taking SAT Exam: 33.8%
Average Combined Score: 1,283.8
Critical Reading Average: 434.4
Math Average: 430.2
Writing Average: 419.2
Percent Scoring At or Above 1500: 18.8%
CST - Test Proficiency by Grade and Subject
Grade 9 - % of students at or above proficiency
| School | District | State | |
|---|---|---|---|
| CST Algebra I Test | |||
| 2010 | 34.0% | 34.0% | 22.0% |
| 2009 | 44.0% | 44.0% | 21.0% |
| 2008 | 35.0% | 35.0% | 18.0% |
| CST English-Language Arts Test | |||
| 2010 | 50.0% | 49.0% | 54.0% |
| 2009 | 48.0% | 48.0% | 50.0% |
| 2008 | 44.0% | 43.0% | 49.0% |
| CST Geometry Test | |||
| 2010 | 33.0% | 33.0% | 46.0% |
| 2009 | 58.0% | 58.0% | 47.0% |
| 2008 | 39.0% | 39.0% | 43.0% |
| CST Integrated/Coordinated Science Test | |||
| 2010 | 16.0% | 16.0% | 19.0% |
| 2009 | 19.0% | 19.0% | 15.0% |
| 2008 | 13.0% | 13.0% | 5.0% |
Grade 10 - % of students at or above proficiency
| School | District | State | |
|---|---|---|---|
| CST Algebra I Test | |||
| 2010 | 25.0% | 23.0% | 12.0% |
| 2009 | 15.0% | 12.0% | 11.0% |
| 2008 | 13.0% | 11.0% | 9.0% |
| CST Algebra II Test | |||
| 2010 | 48.0% | 48.0% | 40.0% |
| 2009 | 62.0% | 62.0% | 37.0% |
| 2008 | 52.0% | 52.0% | 36.0% |
| CST Biology Test | |||
| 2010 | 36.0% | 36.0% | 38.0% |
| 2009 | 32.0% | 31.0% | 34.0% |
| 2008 | 33.0% | 30.0% | 35.0% |
| CST English-Language Arts Test | |||
| 2010 | 40.0% | 39.0% | 45.0% |
| 2009 | 34.0% | 33.0% | 44.0% |
| 2008 | 28.0% | 26.0% | 41.0% |
| CST Geometry Test | |||
| 2010 | 10.0% | 10.0% | 14.0% |
| 2009 | 7.0% | 7.0% | 14.0% |
| 2008 | 6.0% | 6.0% | 12.0% |
| CST Science Test | |||
| 2010 | 37.0% | 36.0% | 46.0% |
| 2009 | 36.0% | 35.0% | 44.0% |
| 2008 | 31.0% | 29.0% | 40.0% |
| CST World History Test | |||
| 2010 | 29.0% | 28.0% | 42.0% |
| 2009 | 29.0% | 28.0% | 38.0% |
| 2008 | 22.0% | 21.0% | 33.0% |
Grade 11 - % of students at or above proficiency
| School | District | State | |
|---|---|---|---|
| CST Algebra I Test | |||
| 2010 | 14.0% | 15.0% | 8.0% |
| 2009 | 9.0% | 7.0% | 8.0% |
| 2008 | 8.0% | 6.0% | 5.0% |
| CST Biology Test | |||
| 2010 | 12.0% | 12.0% | 46.0% |
| 2009 | 4.0% | 3.0% | 41.0% |
| CST Chemistry Test | |||
| 2010 | 15.0% | 15.0% | 30.0% |
| 2009 | 5.0% | 5.0% | 27.0% |
| CST English-Language Arts Test | |||
| 2010 | 31.0% | 31.0% | 42.0% |
| 2009 | 25.0% | 23.0% | 40.0% |
| 2008 | 33.0% | 31.0% | 37.0% |
| CST Geometry Test | |||
| 2010 | 9.0% | 8.0% | 6.0% |
| 2009 | 2.0% | 2.0% | 7.0% |
| 2008 | 8.0% | 8.0% | 6.0% |
| CST U.S. History Test | |||
| 2010 | 42.0% | 41.0% | 45.0% |
| 2009 | 36.0% | 33.0% | 44.0% |
| 2008 | 48.0% | 44.0% | 38.0% |
| CST Algebra II Test | |||
| 2009 | 3.0% | 3.0% | 12.0% |
| 2008 | 19.0% | 19.0% | 11.0% |
| CST Summative High School Math Test | |||
| 2009 | 23.0% | 21.0% | 47.0% |
| 2008 | 27.0% | 27.0% | 43.0% |
| CST Integrated/Coordinated Science Test | |||
| 2008 | 3.0% | 3.0% | 10.0% |
End of Course - % of students at or above proficiency
| School | District | State | |
|---|---|---|---|
| CST Algebra I Test | |||
| 2010 | 29.0% | 31.0% | 31.0% |
| 2009 | 31.0% | 31.0% | 28.0% |
| 2008 | 25.0% | 28.0% | 25.0% |
| CST Algebra II Test | |||
| 2010 | 19.0% | 19.0% | 31.0% |
| 2009 | 19.0% | 19.0% | 28.0% |
| 2008 | 35.0% | 35.0% | 27.0% |
| CST Biology Test | |||
| 2010 | 33.0% | 33.0% | 46.0% |
| 2009 | 28.0% | 25.0% | 42.0% |
| 2008 | 34.0% | 31.0% | 42.0% |
| CST Chemistry Test | |||
| 2010 | 15.0% | 15.0% | 38.0% |
| 2009 | 5.0% | 5.0% | 36.0% |
| CST Geometry Test | |||
| 2010 | 16.0% | 15.0% | 27.0% |
| 2009 | 15.0% | 15.0% | 26.0% |
| 2008 | 10.0% | 10.0% | 24.0% |
| CST Integrated/Coordinated Science Test | |||
| 2010 | 15.0% | 15.0% | 16.0% |
| 2009 | 19.0% | 19.0% | 13.0% |
| 2008 | 12.0% | 12.0% | 11.0% |
| CST World History Test | |||
| 2010 | 26.0% | 26.0% | 41.0% |
| 2009 | 29.0% | 28.0% | 38.0% |
| 2008 | 21.0% | 19.0% | 33.0% |
| CST Summative High School Math Test | |||
| 2009 | 23.0% | 21.0% | 50.0% |
| 2008 | 27.0% | 27.0% | 47.0% |
Source: CA Department of Education 2009-2010
School Map and Similar Schools Nearby
Click to Activate Map of Nearby School Campuses
Private
Public
This School
Similar Schools Nearby
| Riverdale High School 9-12 | 524 Students | 7.5 miles away | Not Yet Rated | |
| Washington High School 9-12 | 1,185 Students | 8.1 miles away | Not Yet Rated | |
| Laton High School 9-12 | 191 Students | 11.2 miles away | ![]() 4 out of 5 | |
| Fowler High School 9-12 | 701 Students | 11.3 miles away | ![]() 5 out of 5 | |
| Selma High School 9-12 | 1,681 Students | 12.8 miles away | Not Yet Rated | |
| Edison High School 9-12 | 2,332 Students | 12.8 miles away | Not Yet Rated | |
| Roosevelt High School 9-12 | 2,426 Students | 14.9 miles away | Not Yet Rated | |
| Sunnyside High School 9-12 | 3,193 Students | 15.1 miles away | ![]() 4 out of 5 | |
| Fresno High School 9-12 | 2,676 Students | 15.9 miles away | Not Yet Rated | |
| Sierra Pacific High School 9-12 | 217 Students | 16.2 miles away | Not Yet Rated | - |
Compare This School To Nearby Schools ->
School Community Forum

Join a discussion about Caruthers High School and talk to others in the community including students, parents, teachers, and administrators.
Popular Discussion Topics
- Admissions and Registration Questions (e.g. Dress Code and Discipline Policy)
- School Calendar and Upcoming Events (e.g. Graduation)
- After School Programs, Extracurricular Activities, and Athletics (e.g. Football)
- News and Announcements (e.g. Yearbook and Class Supply List Details)
- Graduate and Alumni Events (e.g. Organizing Class Reunions)
Navigation
Can't Find What You Are Looking For?
Rankings
Nearby Cities
Sponsored Links
K-12 Articles
Parent-Teacher Conference Dos and Don'ts
Finals are over and done, and grades have arrived. Now comes the dreaded time to discuss the...
Tips for Easing Your Child's Back to School Stress
Do you remember the roller coaster of emotions that you experienced as a child when the day for...
Promoting Childhood Literacy
The number of American adults who are illiterate is astounding. People who lack the ability to read...


