Spring Valley Elementary School
Rating
Not Available
Not Available

No Reviews Yet
Find Old Friends From Spring Valley Elementary School
Use the form below to search for alumni from Spring Valley Elementary School.
School Description
School Summary and Highlights
- Enrolls 89 elementary school students from grades KG-5
- Ranks 2358th out of 5,423 elementary schools in CA.
- 2010 Overall School AYP Met Status: Yes
Additional Contact Information
- Mailing Address: PO Box 9, O'neals, CA 93645
School Operational Details
- Title I EligibleAll students of this school are eligible for participation in authorized programs.
School District Details
- Chawanakee Unified School District
- Per-Pupil Spending: $11,295
- Graduation Rate: 44.9%
- Dropout Rate: 6.3%
- Students Per Teacher: 15.8
- Enrolled Students: 756
Faculty Details and Student Enrollment
Students and Faculty
- Total Students Enrolled: 89
- Total Full Time "Equivalent" Teachers: 6.5
- Average Student-To-Teacher Ratio: 13.7
Students Gender Breakdown
- Males: 46 (51.7%)
- Females: 43 (48.3%)
Free Lunch Student Eligibility Breakdown
- Eligible for Reduced Lunch: 5 (5.6%)
- Eligible for Free Lunch: 22 (24.7%)
- Eligible for Either Reduced or Free Lunch: 27 (30.3%)
Student Enrollment Distribution by Race / Ethnicity
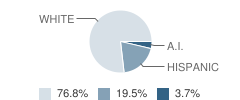
| Number | Percent | |
|---|---|---|
| American Indian | 3 | 3.4% |
| Black | - | - |
| Asian | - | - |
| Hispanic | 16 | 18.0% |
| White | 63 | 70.8% |
Number of Students Per Grade
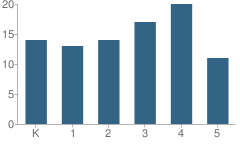
| Number | Percent | |
|---|---|---|
| Kindergarten | 14 | 15.7% |
| 1st Grade | 13 | 14.6% |
| 2nd Grade | 14 | 15.7% |
| 3rd Grade | 17 | 19.1% |
| 4th Grade | 20 | 22.5% |
| 5th Grade | 11 | 12.4% |
Teacher Credentials & Experience (2009)
Percent of Teachers With Credentials: 100.0%
Number of Certificated Staff: 7.0
Average Number of Years of Teacher Experience: 16.0
Average Age
School:
43.9
District:
46.0
Source: CA Department of Education, Source: NCES 2009-2010
School Ratings and Reviews
Be The First To Review Spring Valley Elementary School!
School Map and Similar Schools Nearby
Click to Activate Map of Nearby School Campuses
Private
Public
This School
Similar Schools Nearby
| Rivergold Elementary School KG-8 | 581 Students | 6.2 miles away | Not Yet Rated | |
| Coarsegold Elementary School KG-8 | 452 Students | 9.3 miles away | Not Yet Rated | |
| Raymond-Knowles Elementary School KG-8 | 79 Students | 11.4 miles away | Not Yet Rated | |
| Sierra View Elementary School KG-6 | 349 Students | 12.5 miles away |  5 out of 5 | |
| Foothill Middle School 4-8 | 573 Students | 12.6 miles away | Not Yet Rated | |
| Auberry Elementary School KG-3 | 194 Students | 14.2 miles away | Not Yet Rated | |
| North Fork Elementary School KG-5 | 203 Students | 14.8 miles away | Not Yet Rated | |
| Oakhurst Elementary School KG-5 | 334 Students | 15.0 miles away | Not Yet Rated | |
| Webster Elementary School KG-6 | 610 Students | 15.8 miles away | 5 out of 5 | |
| James S. Fugman Elementary School KG-6 | 636 Students | 16.1 miles away | Not Yet Rated | |
Compare This School To Nearby Schools ->
Navigation
Can't Find What You Are Looking For?
Rankings
Nearby Cities
Sponsored Links
K-12 Articles

Parent-Teacher Conference Dos and Don'ts
Finals are over and done, and grades have arrived. Now comes the dreaded time to discuss the...
Finals are over and done, and grades have arrived. Now comes the dreaded time to discuss the...

Homework Helps
School has started throughout the country and is well into the first month-some schools are...
School has started throughout the country and is well into the first month-some schools are...

Teaching Your Child Study Skills
Many children who have the capability to get good grades experience frustration because of low...
Many children who have the capability to get good grades experience frustration because of low...