Magnolia High School

1 out of 5 | 1 Review
Find Old Friends From Magnolia High School
Use the form below to search for alumni from Magnolia High School.
School Description
School Summary and Highlights
- Enrolls 2,228 high school students from grades 9-12
- Ranks 957th out of 1,197 high schools in CA.
- 2010 Overall School AYP Met Status: No
Additional Contact Information
- Mailing Address: 2450 West Ball Rd., Anaheim, CA 92804
School Operational Details
- Title I Eligible
School District Details
- Anaheim Union High School District
- Per-Pupil Spending: $9,347
- Graduation Rate: 62.3%
- Dropout Rate: 2.3%
- Students Per Teacher: 24.1
- Enrolled Students: 33,158
Faculty Details and Student Enrollment
Students and Faculty
- Total Students Enrolled: 2,228
- Total Full Time "Equivalent" Teachers: 86.0
- Average Student-To-Teacher Ratio: 25.9
Students Gender Breakdown
- Males: 1,181 (53.0%)
- Females: 1,047 (47.0%)
Free Lunch Student Eligibility Breakdown
- Eligible for Reduced Lunch: 280 (12.6%)
- Eligible for Free Lunch: 1,347 (60.5%)
- Eligible for Either Reduced or Free Lunch: 1,627 (73.0%)
Student Enrollment Distribution by Race / Ethnicity
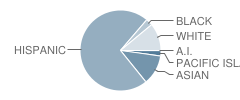
| Number | Percent | |
|---|---|---|
| American Indian | 2 | 0.09% |
| Black | 61 | 2.7% |
| Asian | 267 | 12.0% |
| Hispanic | 1,601 | 71.9% |
| White | 245 | 11.0% |
Number of Students Per Grade
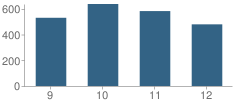
| Number | Percent | |
|---|---|---|
| 9th Grade | 530 | 23.8% |
| 10th Grade | 637 | 28.6% |
| 11th Grade | 582 | 26.1% |
| 12th Grade | 479 | 21.5% |
Graduates Information (2010)
Graduation Rate
School:
81.4%
District:
84.6%
State:
78.6%
Teacher Education Background (2009)
Percent With Ph.D.
School:
2.1%
District:
12.7%
Percent With Master's Degree
School:
36.2%
District:
11.1%
Percent With Bachelor's Degree: 44.7%
Teacher Credentials & Experience (2009)
Percent of Teachers With Credentials: 94.1%
Number of Certificated Staff: 94.0
Average Number of Years of Teacher Experience: 10.0
Average Age
School:
39.4
District:
46.2
Source: CA Department of Education, Source: NCES 2009-2010
Sponsored Links
Test Scores and Performance Information
Overall School Rating
How is this determined?
The overall school rating shows that Magnolia High School performed on average worse than many other schools across the state on CST state exams in the following subjects:
- CST Algebra I
- CST Algebra II
- CST Biology
- CST Chemistry
- CST Earth Science
- CST English-Language Arts
- CST Geometry
- CST Integrated/Coordinated Science
- CST Physics
- CST Science
- CST Summative High School Math
- CST U.S. History
- CST World History
AYP Results (2010)
Overall AYP Met: No
ELA AYP Met: No
Math AYP Met: No
Program Improvement (PI) Requirement Under NCLB (2010)
First Year PI Requirement was Implemented: 2009-2010
School's Placement Under NCLB: Year 2
ACT Exam Results (2009)
Percent of Students Taking ACT Exam: 2.5%
SAT Exam Results (2009)
Percent of Students Taking SAT Exam: 41.2%
Average Combined Score: 1,366.1
Critical Reading Average: 454.1
Math Average: 461.0
Writing Average: 451.0
Percent Scoring At or Above 1500: 28.8%
CST - Test Proficiency by Grade and Subject
Grade 9 - % of students at or above proficiency
| School | District | State | |
|---|---|---|---|
| CST Algebra I Test | |||
| 2010 | 7.0% | 21.0% | 22.0% |
| 2009 | 4.0% | 16.0% | 21.0% |
| 2008 | 9.0% | 16.0% | 18.0% |
| CST Biology Test | |||
| 2010 | 36.0% | 66.0% | 55.0% |
| 2009 | 28.0% | 61.0% | 51.0% |
| 2008 | 45.0% | 66.0% | 52.0% |
| CST Earth Science Test | |||
| 2010 | 26.0% | 29.0% | 35.0% |
| 2009 | 14.0% | 18.0% | 29.0% |
| 2008 | 16.0% | 25.0% | 31.0% |
| CST English-Language Arts Test | |||
| 2010 | 47.0% | 56.0% | 54.0% |
| 2009 | 36.0% | 48.0% | 50.0% |
| 2008 | 43.0% | 50.0% | 49.0% |
| CST Geometry Test | |||
| 2010 | 27.0% | 49.0% | 46.0% |
| 2009 | 29.0% | 49.0% | 47.0% |
| 2008 | 36.0% | 53.0% | 43.0% |
Grade 10 - % of students at or above proficiency
| School | District | State | |
|---|---|---|---|
| CST Algebra I Test | |||
| 2010 | 4.0% | 14.0% | 12.0% |
| 2009 | 5.0% | 11.0% | 11.0% |
| 2008 | 6.0% | 13.0% | 9.0% |
| CST Algebra II Test | |||
| 2010 | 27.0% | 49.0% | 40.0% |
| 2009 | 27.0% | 48.0% | 37.0% |
| 2008 | 30.0% | 53.0% | 36.0% |
| CST Biology Test | |||
| 2010 | 9.0% | 28.0% | 38.0% |
| 2009 | 15.0% | 25.0% | 34.0% |
| 2008 | 18.0% | 35.0% | 35.0% |
| CST Chemistry Test | |||
| 2010 | 33.0% | 49.0% | 47.0% |
| 2009 | 33.0% | 43.0% | 44.0% |
| 2008 | 51.0% | 49.0% | 41.0% |
| CST Earth Science Test | |||
| 2010 | 27.0% | 28.0% | 29.0% |
| 2009 | 8.0% | 22.0% | 23.0% |
| 2008 | 12.0% | 13.0% | 23.0% |
| CST English-Language Arts Test | |||
| 2010 | 33.0% | 46.0% | 45.0% |
| 2009 | 36.0% | 45.0% | 44.0% |
| 2008 | 31.0% | 42.0% | 41.0% |
| CST Geometry Test | |||
| 2010 | 6.0% | 18.0% | 14.0% |
| 2009 | 6.0% | 13.0% | 14.0% |
| 2008 | 11.0% | 23.0% | 12.0% |
| CST Science Test | |||
| 2010 | 32.0% | 47.0% | 46.0% |
| 2009 | 28.0% | 44.0% | 44.0% |
| 2008 | 29.0% | 42.0% | 40.0% |
| CST World History Test | |||
| 2010 | 28.0% | 46.0% | 42.0% |
| 2009 | 31.0% | 43.0% | 38.0% |
| 2008 | 25.0% | 38.0% | 33.0% |
Grade 11 - % of students at or above proficiency
| School | District | State | |
|---|---|---|---|
| CST Algebra I Test | |||
| 2010 | 4.0% | 14.0% | 8.0% |
| 2009 | 1.0% | 13.0% | 8.0% |
| 2008 | 7.0% | 10.0% | 5.0% |
| CST Algebra II Test | |||
| 2010 | 3.0% | 18.0% | 14.0% |
| 2009 | 5.0% | 22.0% | 12.0% |
| 2008 | 14.0% | 21.0% | 11.0% |
| CST Biology Test | |||
| 2010 | 47.0% | 54.0% | 46.0% |
| 2009 | 50.0% | 52.0% | 41.0% |
| 2008 | 43.0% | 63.0% | 39.0% |
| CST Chemistry Test | |||
| 2010 | 11.0% | 27.0% | 30.0% |
| 2009 | 9.0% | 22.0% | 27.0% |
| 2008 | 22.0% | 26.0% | 25.0% |
| CST Earth Science Test | |||
| 2010 | 37.0% | 29.0% | 32.0% |
| 2009 | 21.0% | 21.0% | 26.0% |
| 2008 | 18.0% | 15.0% | 28.0% |
| CST English-Language Arts Test | |||
| 2010 | 39.0% | 45.0% | 42.0% |
| 2009 | 29.0% | 40.0% | 40.0% |
| 2008 | 33.0% | 38.0% | 37.0% |
| CST Geometry Test | |||
| 2010 | 4.0% | 9.0% | 6.0% |
| 2009 | 4.0% | 9.0% | 7.0% |
| 2008 | 9.0% | 9.0% | 6.0% |
| CST Integrated/Coordinated Science Test | |||
| 2010 | 6.0% | 18.0% | 8.0% |
| CST Physics Test | |||
| 2010 | 13.0% | 55.0% | 53.0% |
| 2009 | 21.0% | 59.0% | 50.0% |
| 2008 | 18.0% | 55.0% | 47.0% |
| CST Summative High School Math Test | |||
| 2010 | 32.0% | 55.0% | 50.0% |
| 2009 | 25.0% | 52.0% | 47.0% |
| 2008 | 25.0% | 57.0% | 43.0% |
| CST U.S. History Test | |||
| 2010 | 32.0% | 49.0% | 45.0% |
| 2009 | 30.0% | 47.0% | 44.0% |
| 2008 | 32.0% | 43.0% | 38.0% |
| CST World History Test | |||
| 2009 | 8.0% | 8.0% | 11.0% |
| 2008 | 9.0% | 14.0% | 9.0% |
End of Course - % of students at or above proficiency
| School | District | State | |
|---|---|---|---|
| CST Algebra I Test | |||
| 2010 | 6.0% | 24.0% | 31.0% |
| 2009 | 5.0% | 21.0% | 28.0% |
| 2008 | 8.0% | 24.0% | 25.0% |
| CST Algebra II Test | |||
| 2010 | 13.0% | 37.0% | 31.0% |
| 2009 | 16.0% | 36.0% | 28.0% |
| 2008 | 22.0% | 36.0% | 27.0% |
| CST Biology Test | |||
| 2010 | 25.0% | 49.0% | 46.0% |
| 2009 | 26.0% | 45.0% | 42.0% |
| 2008 | 31.0% | 50.0% | 42.0% |
| CST Chemistry Test | |||
| 2010 | 25.0% | 41.0% | 38.0% |
| 2009 | 22.0% | 33.0% | 36.0% |
| 2008 | 36.0% | 37.0% | 32.0% |
| CST Earth Science Test | |||
| 2010 | 27.0% | 29.0% | 33.0% |
| 2009 | 15.0% | 20.0% | 28.0% |
| 2008 | 16.0% | 22.0% | 28.0% |
| CST Geometry Test | |||
| 2010 | 13.0% | 29.0% | 27.0% |
| 2009 | 12.0% | 24.0% | 26.0% |
| 2008 | 18.0% | 29.0% | 24.0% |
| CST Integrated/Coordinated Science Test | |||
| 2010 | 6.0% | 18.0% | 16.0% |
| CST Physics Test | |||
| 2010 | 13.0% | 56.0% | 49.0% |
| 2009 | 25.0% | 60.0% | 46.0% |
| 2008 | 18.0% | 56.0% | 43.0% |
| CST Summative High School Math Test | |||
| 2010 | 33.0% | 59.0% | 54.0% |
| 2009 | 25.0% | 54.0% | 50.0% |
| 2008 | 25.0% | 56.0% | 47.0% |
| CST World History Test | |||
| 2010 | 28.0% | 45.0% | 41.0% |
| 2009 | 31.0% | 42.0% | 38.0% |
| 2008 | 24.0% | 38.0% | 33.0% |
Source: CA Department of Education 2009-2010
School Map and Similar Schools Nearby
Click to Activate Map of Nearby School Campuses
Private
Public
This School
Similar Schools Nearby
| Dale Junior High School 7-8 | 1,314 Students | 0.7 miles away | Not Yet Rated | |
| Savanna High School 9-12 | 2,325 Students | 1.3 miles away | Not Yet Rated | |
| Rancho Alamitos High School 9-12 | 1,997 Students | 1.5 miles away | ![]() 5 out of 5 | |
| Loara High School 9-12 | 2,686 Students | 1.6 miles away | ![]() 2 out of 5 | |
| Brookhurst Junior High School 7-8 | 1,325 Students | 1.9 miles away | Not Yet Rated | |
| Western High School 9-12 | 2,321 Students | 2.0 miles away | ![]() 1 out of 5 | |
| Ball Junior High School 7-8 | 1,237 Students | 2.2 miles away | Not Yet Rated | |
| Orangeview Junior High School 7-8 | 1,016 Students | 2.5 miles away | Not Yet Rated | |
| Anaheim High School 9-12 | 3,337 Students | 3.0 miles away | Not Yet Rated | |
| Garden Grove High School 9-12 | 2,306 Students | 3.2 miles away | Not Yet Rated | |
Compare This School To Nearby Schools ->
School Community Forum

Join a discussion about Magnolia High School and talk to others in the community including students, parents, teachers, and administrators.
Popular Discussion Topics
- Admissions and Registration Questions (e.g. Dress Code and Discipline Policy)
- School Calendar and Upcoming Events (e.g. Graduation)
- After School Programs, Extracurricular Activities, and Athletics (e.g. Football)
- News and Announcements (e.g. Yearbook and Class Supply List Details)
- Graduate and Alumni Events (e.g. Organizing Class Reunions)
Navigation
Can't Find What You Are Looking For?
Rankings
Nearby Cities
Sponsored Links
K-12 Articles
The Adolescent Monster
"What happened to my sweet little baby?" Every parent has or will ask that sometime during the...
Teacher Tenure: A Double-Edged Sword
Teacher Tenure (the policy making it almost impossible to fire teachers) has noble roots. It was...
Feeling Good in Your Own Skin
Body image is a very touchy issue with today's kids. Since the 1950s, when Barbie was first...


(1 / 5) 

