Banta Elementary School
Rating
Not Available
Not Available

5 out of 5 | 1 Review
Find Old Friends From Banta Elementary School
Use the form below to search for alumni from Banta Elementary School.
School Description
School Summary and Highlights
- Enrolls 290 elementary school students from grades KG-8
- Ranks 1147th out of 2,050 middle schools in CA.
- 2010 Overall School AYP Met Status: No
Additional Contact Information
- Mailing Address: 22345 South El Rancho Rd., Tracy, CA 95376
School Operational Details
- Title I Eligible
School District Details
- Banta Elementary School District
- Per-Pupil Spending: $8,804
- Students Per Teacher: 20.7
- Enrolled Students: 290
Faculty Details and Student Enrollment
Students and Faculty
- Total Students Enrolled: 290
- Total Full Time "Equivalent" Teachers: 14.0
- Average Student-To-Teacher Ratio: 20.7
Students Gender Breakdown
- Males: 143 (49.3%)
- Females: 147 (50.7%)
Free Lunch Student Eligibility Breakdown
- Eligible for Reduced Lunch: 38 (13.1%)
- Eligible for Free Lunch: 139 (47.9%)
- Eligible for Either Reduced or Free Lunch: 177 (61.0%)
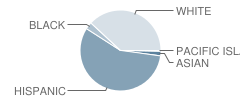
Student Enrollment Distribution by Race / Ethnicity
| Number | Percent | |
|---|---|---|
| American Indian | - | - |
| Black | 8 | 2.8% |
| Asian | 5 | 1.7% |
| Hispanic | 160 | 55.2% |
| White | 107 | 36.9% |
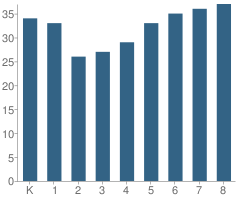
Number of Students Per Grade
| Number | Percent | |
|---|---|---|
| Kindergarten | 34 | 11.7% |
| 1st Grade | 33 | 11.4% |
| 2nd Grade | 26 | 9.0% |
| 3rd Grade | 27 | 9.3% |
| 4th Grade | 29 | 10.0% |
| 5th Grade | 33 | 11.4% |
| 6th Grade | 35 | 12.1% |
| 7th Grade | 36 | 12.4% |
| 8th Grade | 37 | 12.8% |
Teacher Credentials & Experience (2009)
Percent of Teachers With Credentials: 100.0%
Number of Certificated Staff: 16.0
Average Number of Years of Teacher Experience: 12.6
Average Age: 45.1
Source: CA Department of Education, Source: NCES 2009-2010
School Ratings and Reviews
Overall Rating: 5

5 out of 5 | 1 Review
The Overall Rating is the school's average rating from parents, students, school faculty and staff. The highest rating is five apples and the lowest is one apple.
Share Your Review About This School
1 review for Banta Elementary School
- Reviewed by Parent/Guardian on May 01, 2010
- Rating:
 (5 / 5) Flag as inappropriate
 - If you are looking for a small rural school for your child, then Banta would be the right place to go. Small class sizes and teachers that care. Great Resource teacher and program
School Map and Similar Schools Nearby
Click to Activate Map of Nearby School Campuses
Private
Public
This School
Similar Schools Nearby
| North Elementary School KG-8 | 812 Students | 2.9 miles away | Not Yet Rated | |
| Central Elementary School KG-5 | 469 Students | 3.1 miles away |  4 out of 5 | |
| Louis A. Bohn Elementary School KG-5 | 505 Students | 3.2 miles away | Not Yet Rated | |
| Mckinley Elementary School KG-5 | 418 Students | 3.5 miles away | Not Yet Rated | |
| South / West Park Elementary School KG-5 | 935 Students | 3.8 miles away |  2 out of 5 | |
| Gladys Poet-Christian Elementary School KG-8 | 692 Students | 4.0 miles away | Not Yet Rated | |
| Melville S. Jacobson Elementary School KG-5 | 652 Students | 4.1 miles away | Not Yet Rated | |
| Louis J. Villalovoz Elementary School KG-5 | 624 Students | 4.2 miles away | Not Yet Rated | |
| Art Freiler School KG-8 | 1,030 Students | 4.4 miles away |  4.5 out of 5 | |
| Wanda Hirsch Elementary School KG-5 | 663 Students | 4.7 miles away |  5 out of 5 | |
Compare This School To Nearby Schools ->
School Community Forum

Join a discussion about Banta Elementary School and talk to others in the community including students, parents, teachers, and administrators.
Popular Discussion Topics
- Admissions and Registration Questions (e.g. Dress Code and Discipline Policy)
- School Calendar and Upcoming Events (e.g. Graduation)
- After School Programs, Extracurricular Activities, and Athletics (e.g. Football)
- News and Announcements (e.g. Yearbook and Class Supply List Details)
- Graduate and Alumni Events (e.g. Organizing Class Reunions)
Navigation
Can't Find What You Are Looking For?
Rankings
Nearby Cities
Sponsored Links
K-12 Articles

It's the Most Wonderful Time of the Year!
For most of the country, school is starting up this week or later this month-at the beginning of...
For most of the country, school is starting up this week or later this month-at the beginning of...

Keeping Our Kids Safe in the Post 9/11 World
Recently, radio talk show host and CNN personality did a week-long special entitled "The Perfect...
Recently, radio talk show host and CNN personality did a week-long special entitled "The Perfect...

The Importance of Reading for Children Preschool to Grade Three
The first teachers of children are their parents. From the time they are infants, children need to...
The first teachers of children are their parents. From the time they are infants, children need to...