Huron Middle School
Rating
Not Available
Not Available

No Reviews Yet
Find Old Friends From Huron Middle School
Use the form below to search for alumni from Huron Middle School.
School Description
School Summary and Highlights
- Enrolls 341 middle school students from grades 6-8
- Ranks 1787th out of 2,050 middle schools in CA.
- 2010 Overall School AYP Met Status: Yes
Additional Contact Information
- Mailing Address: PO Box 99, Huron, CA 93234
School Operational Details
- Title I EligibleAll students of this school are eligible for participation in authorized programs.
School District Details
- Coalinga-Huron Joint Unified School District
- Per-Pupil Spending: $8,738
- Graduation Rate: 58.2%
- Dropout Rate: 5.9%
- Students Per Teacher: 23.2
- Enrolled Students: 4,367
Faculty Details and Student Enrollment
Students and Faculty
- Total Students Enrolled: 341
- Total Full Time "Equivalent" Teachers: 17.0
- Average Student-To-Teacher Ratio: 20.1
Students Gender Breakdown
- Males: 180 (52.8%)
- Females: 161 (47.2%)
Free Lunch Student Eligibility Breakdown
- Eligible for Reduced Lunch: 8 (2.3%)
- Eligible for Free Lunch: 241 (70.7%)
- Eligible for Either Reduced or Free Lunch: 249 (73.0%)
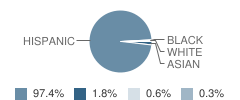
Student Enrollment Distribution by Race / Ethnicity
| Number | Percent | |
|---|---|---|
| American Indian | - | - |
| Black | 1 | 0.3% |
| Asian | 6 | 1.8% |
| Hispanic | 331 | 97.1% |
| White | 2 | 0.6% |
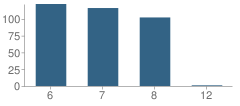
Number of Students Per Grade
| Number | Percent | |
|---|---|---|
| 6th Grade | 122 | 35.8% |
| 7th Grade | 116 | 34.0% |
| 8th Grade | 102 | 29.9% |
| 12th Grade | 1 | 0.3% |
Teacher Education Background (2009)
Percent With Master's Degree
School:
4.8%
District:
27.3%
Percent With Bachelor's Degree
School:
47.6%
District:
27.3%
Teacher Credentials & Experience (2009)
Percent of Teachers With Emergency Credentials: 21.1%
Percent of Teachers With Credentials: 84.2%
Number of Certificated Staff: 21.0
Average Number of Years of Teacher Experience: 5.2
Average Age
School:
32.9
District:
51.7
Source: CA Department of Education, Source: NCES 2009-2010
School Ratings and Reviews
Be The First To Review Huron Middle School!
School Map and Similar Schools Nearby
Click to Activate Map of Nearby School Campuses
Private
Public
This School
Similar Schools Nearby
| Reef Sunset Middle School 6-8 | 502 Students | 13.1 miles away | Not Yet Rated | |
| Westside Elementary School KG-8 | 246 Students | 14.1 miles away | Not Yet Rated | |
| Coalinga Middle School 6-8 | 652 Students | 14.9 miles away | Not Yet Rated | |
| Kettleman City Elementary School KG-8 | 297 Students | 15.4 miles away | Not Yet Rated | |
| Stratford Elementary School KG-8 | 282 Students | 15.7 miles away | Not Yet Rated | |
| P. W. Engvall Elementary School KG-6 | 725 Students | 18.1 miles away |  5 out of 5 | |
| Central Elementary School KG-8 | 370 Students | 18.2 miles away | Not Yet Rated | |
| Liberty Middle School 7-8 | 642 Students | 18.8 miles away | Not Yet Rated | |
| Lemoore Elementary School KG-6 | 680 Students | 19.6 miles away | Not Yet Rated | |
| Cinnamon Elementary School KG-6 | 582 Students | 19.6 miles away | Not Yet Rated | |
Compare This School To Nearby Schools ->
School Community Forum

Join a discussion about Huron Middle School and talk to others in the community including students, parents, teachers, and administrators.
Popular Discussion Topics
- Admissions and Registration Questions (e.g. Dress Code and Discipline Policy)
- School Calendar and Upcoming Events (e.g. Graduation)
- After School Programs, Extracurricular Activities, and Athletics (e.g. Football)
- News and Announcements (e.g. Yearbook and Class Supply List Details)
- Graduate and Alumni Events (e.g. Organizing Class Reunions)
Navigation
Can't Find What You Are Looking For?
Rankings
Nearby Cities
Sponsored Links
K-12 Articles

All About Backpacks
Your child riffles through his backpack to find homework assignments, his MP3 player, lunch money...
Your child riffles through his backpack to find homework assignments, his MP3 player, lunch money...

Tips for Easing Your Child's Back to School Stress
Do you remember the roller coaster of emotions that you experienced as a child when the day for...
Do you remember the roller coaster of emotions that you experienced as a child when the day for...

Helping Your Learning Disabled Child
Thousands of children in America struggle to learn on a daily basis. Many of them have invisible...
Thousands of children in America struggle to learn on a daily basis. Many of them have invisible...