Firebaugh High School
Rating
Not Available
Not Available

4 out of 5 | 1 Review
Find Old Friends From Firebaugh High School
Use the form below to search for alumni from Firebaugh High School.
School Description
School Summary and Highlights
- Enrolls 710 high school students from grades 9-12
- Ranks 1052nd out of 1,197 high schools in CA.
- 2010 Overall School AYP Met Status: No
Additional Contact Information
- Mailing Address: 1976 Morris Kyle Dr., Firebaugh, CA 93622
School Operational Details
- Title I EligibleAll students of this school are eligible for participation in authorized programs.
School District Details
- Firebaugh-Las Deltas Joint Unified School District
- Per-Pupil Spending: $9,307
- Graduation Rate: 71.2%
- Dropout Rate: 2.5%
- Students Per Teacher: 21.0
- Enrolled Students: 2,252
Faculty Details and Student Enrollment
Students and Faculty
- Total Students Enrolled: 710
- Total Full Time "Equivalent" Teachers: 32.7
- Average Student-To-Teacher Ratio: 21.7
Students Gender Breakdown
- Males: 355 (50.0%)
- Females: 355 (50.0%)
Free Lunch Student Eligibility Breakdown
- Eligible for Reduced Lunch: 49 (6.9%)
- Eligible for Free Lunch: 599 (84.4%)
- Eligible for Either Reduced or Free Lunch: 648 (91.3%)
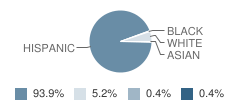
Student Enrollment Distribution by Race / Ethnicity
| Number | Percent | |
|---|---|---|
| American Indian | - | - |
| Black | 3 | 0.4% |
| Asian | 3 | 0.4% |
| Hispanic | 667 | 93.9% |
| White | 37 | 5.2% |
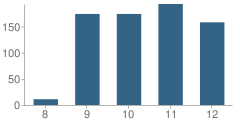
Number of Students Per Grade
| Number | Percent | |
|---|---|---|
| 8th Grade | 11 | 1.5% |
| 9th Grade | 174 | 24.5% |
| 10th Grade | 174 | 24.5% |
| 11th Grade | 193 | 27.2% |
| 12th Grade | 158 | 22.3% |
Graduates Information (2010)
Graduation Rate
School:
91.0%
District:
87.8%
State:
78.6%
Teacher Education Background (2009)
Percent With Bachelor's Degree
School:
13.5%
District:
16.7%
Percent With Master's Degree
School:
13.5%
District:
25.0%
Teacher Credentials & Experience (2009)
Average Age
School:
41.2
District:
46.2
Average Number of Years of Teacher Experience: 14.0
Number of Certificated Staff: 37.0
Percent of Teachers With Credentials: 90.6%
Percent of Teachers With Emergency Credentials: 3.1%
Source: CA Department of Education, Source: NCES 2009-2010
School Ratings and Reviews
Overall Rating: 4

4 out of 5 | 1 Review
The Overall Rating is the school's average rating from parents, students, school faculty and staff. The highest rating is five apples and the lowest is one apple.
Share Your Review About This School
1 review for Firebaugh High School
- Reviewed by Student on June 08, 2007
- Rating:
 (4 / 5) Flag as inappropriate
 - heck i kind of like this school, it is a bit small. Oh, and we still have segregation between men & women like in lunch lines i mean no need come on:(
School Map and Similar Schools Nearby
Click to Activate Map of Nearby School Campuses
Private
Public
This School
Similar Schools Nearby
| Mendota High School 9-12 | 666 Students | 7.8 miles away | Not Yet Rated | |
| Mccabe Junior High School 7-8 | 409 Students | 9.6 miles away |  5 out of 5 | |
| Dos Palos High School 9-12 | 775 Students | 13.8 miles away | Not Yet Rated | |
| Chowchilla High School 9-12 | 951 Students | 21.2 miles away | Not Yet Rated | |
| Madera High North School 9-12 | 2,071 Students | 22.4 miles away | 5 out of 5 | |
| Kerman High School 9-12 | 1,201 Students | 22.6 miles away | Not Yet Rated | |
| Madera South High School 9-12 | 2,701 Students | 22.9 miles away | Not Yet Rated | |
| Los Banos High School 9-12 | 2,367 Students | 25.8 miles away | Not Yet Rated | |
| Los Banos Junior High School 7-8 | 1,407 Students | 25.9 miles away |  4 out of 5 | |
Compare This School To Nearby Schools ->
School Community Forum

Join a discussion about Firebaugh High School and talk to others in the community including students, parents, teachers, and administrators.
Popular Discussion Topics
- Admissions and Registration Questions (e.g. Dress Code and Discipline Policy)
- School Calendar and Upcoming Events (e.g. Graduation)
- After School Programs, Extracurricular Activities, and Athletics (e.g. Football)
- News and Announcements (e.g. Yearbook and Class Supply List Details)
- Graduate and Alumni Events (e.g. Organizing Class Reunions)
Navigation
Can't Find What You Are Looking For?
Rankings
Nearby Cities
Sponsored Links
K-12 Articles

Who is Safe?
Between September 26 and October 2, 2006, there were three deadly school shootings and...
Between September 26 and October 2, 2006, there were three deadly school shootings and...

Your Child and School Corporal Punishment
Your child comes home at the end of the school day with a huge bruise on his upper arm. When you...
Your child comes home at the end of the school day with a huge bruise on his upper arm. When you...

Everyone Loves Going to the Doctor and Dentist
Going to the doctor or dentist can be traumatic for children of all ages. Many adults do not...
Going to the doctor or dentist can be traumatic for children of all ages. Many adults do not...