Dunsmore Elementary School
Rating
Not Available
Not Available

No Reviews Yet
Find Old Friends From Dunsmore Elementary School
Use the form below to search for alumni from Dunsmore Elementary School.
School Description
School Summary and Highlights
- Enrolls 443 elementary school students from grades KG-6
- Ranks 647th out of 5,423 elementary schools in CA.
- 2010 Overall School AYP Met Status: Yes
Additional Contact Information
- Mailing Address: 4717 Dunsmore Ave., La Crescenta, CA 91214
School District Details
- Glendale Unified School District
- Per-Pupil Spending: $9,083
- Graduation Rate: 87.4%
- Dropout Rate: 2.4%
- Students Per Teacher: 22.8
- Enrolled Students: 26,532
Faculty Details and Student Enrollment
Students and Faculty
- Total Students Enrolled: 443
- Total Full Time "Equivalent" Teachers: 20.0
- Average Student-To-Teacher Ratio: 22.2
Students Gender Breakdown
- Males: 222 (50.1%)
- Females: 221 (49.9%)
Free Lunch Student Eligibility Breakdown
- Eligible for Reduced Lunch: 23 (5.2%)
- Eligible for Free Lunch: 23 (5.2%)
- Eligible for Either Reduced or Free Lunch: 46 (10.4%)
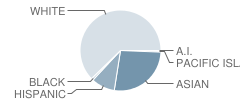
Student Enrollment Distribution by Race / Ethnicity
| Number | Percent | |
|---|---|---|
| American Indian | 2 | 0.5% |
| Black | 4 | 0.9% |
| Asian | 118 | 26.6% |
| Hispanic | 42 | 9.5% |
| White | 273 | 61.6% |
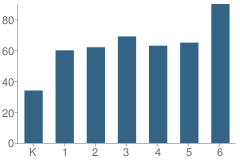
Number of Students Per Grade
| Number | Percent | |
|---|---|---|
| Kindergarten | 34 | 7.7% |
| 1st Grade | 60 | 13.5% |
| 2nd Grade | 62 | 14.0% |
| 3rd Grade | 69 | 15.6% |
| 4th Grade | 63 | 14.2% |
| 5th Grade | 65 | 14.7% |
| 6th Grade | 90 | 20.3% |
Teacher Education Background (2009)
Percent With Master's Degree
School:
13.0%
District:
11.9%
Percent With Bachelor's Degree
School:
4.3%
District:
5.9%
Teacher Credentials & Experience (2009)
Percent of Teachers With Credentials: 95.5%
Number of Certificated Staff: 23.0
Average Number of Years of Teacher Experience: 16.4
Average Age
School:
43.7
District:
46.3
Source: CA Department of Education, Source: NCES 2009-2010
School Ratings and Reviews
Be The First To Review Dunsmore Elementary School!
School Map and Similar Schools Nearby
Click to Activate Map of Nearby School Campuses
Private
Public
This School
Similar Schools Nearby
| Valley View Elementary School KG-6 | 430 Students | 0.4 miles away |  5 out of 5 | |
| Abraham Lincoln Elementary School KG-6 | 497 Students | 0.8 miles away | 5 out of 5 | |
| Mountain View Elementary School KG-5 | 447 Students | 1.1 miles away | 5 out of 5 | |
| Monte Vista Elementary School KG-6 | 570 Students | 1.3 miles away | 5 out of 5 | |
| La Crescenta Elementary School KG-6 | 532 Students | 1.6 miles away | 5 out of 5 | |
| Pinewood Avenue Elementary School KG-5 | 445 Students | 1.8 miles away | 5 out of 5 | |
| Mountain Avenue Elementary School KG-6 | 558 Students | 2.0 miles away |  4 out of 5 | |
| Palm Crest Elementary School KG-6 | 555 Students | 2.5 miles away | 5 out of 5 | |
| Plainview Avenue Elementary School KG-5 | 342 Students | 2.9 miles away |  1 out of 5 | |
| Apperson Street Elementary School KG-5 | 447 Students | 3.0 miles away | Not Yet Rated | |
Compare This School To Nearby Schools ->
School Community Forum

Join a discussion about Dunsmore Elementary School and talk to others in the community including students, parents, teachers, and administrators.
Popular Discussion Topics
- Admissions and Registration Questions (e.g. Dress Code and Discipline Policy)
- School Calendar and Upcoming Events (e.g. Graduation)
- After School Programs, Extracurricular Activities, and Athletics (e.g. Football)
- News and Announcements (e.g. Yearbook and Class Supply List Details)
- Graduate and Alumni Events (e.g. Organizing Class Reunions)
Navigation
Can't Find What You Are Looking For?
Rankings
Nearby Cities
Sponsored Links
K-12 Articles

Keep Your Licensed Teen Safe This Summer
Every year hundreds of teenage drivers lose their lives in motor vehicle accidents. Statistics show...
Every year hundreds of teenage drivers lose their lives in motor vehicle accidents. Statistics show...

Parent and Family Involvement in School
When visiting my grandson's school, I often hear administrators and teachers complaining that not...
When visiting my grandson's school, I often hear administrators and teachers complaining that not...

Nothing New Under the Sun
"I had to go through the same thing when I went to school." Every parent has uttered this phrase,...
"I had to go through the same thing when I went to school." Every parent has uttered this phrase,...