D'hanis School
Rating
Not Available
Not Available

No Reviews Yet
Find Old Friends From D'hanis School
Use the form below to search for alumni from D'hanis School.
School Description
School Summary and Highlights
- Enrolls 317 school students from grades PK-12
- Ranks 711th out of 1,325 high schools in TX.
- 2010 Overall School AYP Met Status: Yes
Additional Contact Information
- Mailing Address: P O Box 307, D'hanis, TX 78850
- Principal or Admin: Michael Poppell
- Fax: (830) 363-7390
School Operational Details
- Title I EligibleAll students of this school are eligible for participation in authorized programs.
School District Details
- D'hanis Independent School District (ISD)
- Per-Pupil Spending: $10,475
- Graduation Rate: 92.3%
- Students Per Teacher: 10.5
- Enrolled Students: 317
Faculty Details and Student Enrollment
Students and Faculty
- Total Students Enrolled: 317
- Total Full Time "Equivalent" Teachers: 30.3
- Average Student-To-Teacher Ratio: 10.5
Students Gender Breakdown
- Males: 172 (54.3%)
- Females: 145 (45.7%)
Free Lunch Student Eligibility Breakdown
- Eligible for Reduced Lunch: 44 (13.9%)
- Eligible for Free Lunch: 116 (36.6%)
- Eligible for Either Reduced or Free Lunch: 160 (50.5%)
Student Enrollment Distribution by Race / Ethnicity
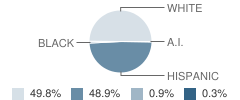
| Number | Percent | |
|---|---|---|
| American Indian | 1 | 0.3% |
| Black | 3 | 0.9% |
| Asian | - | - |
| Hispanic | 155 | 48.9% |
| White | 158 | 49.8% |
Number of Students Per Grade
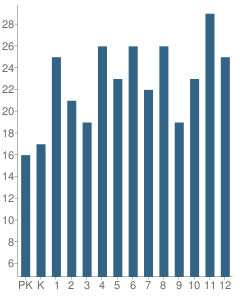
| Number | Percent | |
|---|---|---|
| Pre-Kindergarten | 16 | 5.0% |
| Kindergarten | 17 | 5.4% |
| 1st Grade | 25 | 7.9% |
| 2nd Grade | 21 | 6.6% |
| 3rd Grade | 19 | 6.0% |
| 4th Grade | 26 | 8.2% |
| 5th Grade | 23 | 7.3% |
| 6th Grade | 26 | 8.2% |
| 7th Grade | 22 | 6.9% |
| 8th Grade | 26 | 8.2% |
| 9th Grade | 19 | 6.0% |
| 10th Grade | 23 | 7.3% |
| 11th Grade | 29 | 9.1% |
| 12th Grade | 25 | 7.9% |
Breakdown of College Ready Graduates (2009)
Percent Ready For College in Reading
School:
81.0%
District:
81.0%
State:
62.0%
Percent Ready For College in Math
School:
52.0%
District:
75.0%
State:
60.0%
Graduation & Dropout Rates (2009)
Graduation Rate
School:
91.3%
District:
91.3%
State:
80.6%
Faculty Salary (2010)
School Administration Average Base Salary
School:
$60,666
District:
$60,666
State:
$70,209
Teacher Average Base Salary
School:
$40,883
District:
$40,883
State:
$48,263
Teacher With 1-5 Years Experience Average Base Salary
School:
$32,789
State:
$43,527
Teacher With 6-10 Years Experience Average Base Salary
School:
$38,602
State:
$46,149
Teacher With 11-20 Years Experience Average Base Salary
School:
$44,215
State:
$50,153
Teacher With Greater Than 20 Years Experience Average Base Salary
School:
$53,125
State:
$58,427
Faculty Breakdown (2010)
Average Teacher Experience
School:
11.3
District:
11.3
State:
11.3
Percent of Teachers With 1-5 Years Experience
School:
26.4%
District:
26.4%
State:
31.0%
Percent of Teachers With 6-10 Years Experience
School:
29.7%
District:
29.7%
State:
20.3%
Percent of Teachers With 11-20 Years Experience
School:
28.6%
District:
28.6%
State:
24.4%
Percent of Teachers With Greater Than 20 Years Experience
School:
15.2%
District:
15.2%
State:
18.3%
Source: TX Department of Education, Source: NCES 2009-2010
School Ratings and Reviews
Be The First To Review D'hanis School!
School Map and Similar Schools Nearby
Click to Activate Map of Nearby School Campuses
Private
Public
This School
Similar Schools Nearby
| Hondo High School 9-12 | 628 Students | 8.2 miles away | Not Yet Rated | |
| Sabinal High School 9-12 | 138 Students | 12.0 miles away | Not Yet Rated | |
| Sabinal Junior High School 6-8 | 114 Students | 12.1 miles away | Not Yet Rated | |
| Knippa School PK-12 | 239 Students | 21.9 miles away | Not Yet Rated | |
| Devine High School 9-12 | 528 Students | 24.9 miles away |  3.5 out of 5 | |
| Utopia School PK-12 | 217 Students | 25.2 miles away | Not Yet Rated | |
| Medina Valley High School 9-12 | 1,024 Students | 26.1 miles away | Not Yet Rated | |
| Natalia High School 9-12 | 297 Students | 27.0 miles away |  1 out of 5 | |
| Natalia Junior High School 6-8 | 235 Students | 27.0 miles away | Not Yet Rated | |
| Lytle High School 9-12 | 491 Students | 28.7 miles away |  5 out of 5 | |
Compare This School To Nearby Schools ->
School Community Forum

Join a discussion about D'hanis School and talk to others in the community including students, parents, teachers, and administrators.
Popular Discussion Topics
- Admissions and Registration Questions (e.g. Dress Code and Discipline Policy)
- School Calendar and Upcoming Events (e.g. Graduation)
- After School Programs, Extracurricular Activities, and Athletics (e.g. Football)
- News and Announcements (e.g. Yearbook and Class Supply List Details)
- Graduate and Alumni Events (e.g. Organizing Class Reunions)
Navigation
Can't Find What You Are Looking For?
Nearby Cities
Sponsored Links
K-12 Articles

Teach Your Child to Write Well
When American children head off to junior kindergarten, they must be ready to learn. It is your...
When American children head off to junior kindergarten, they must be ready to learn. It is your...

Parent-Teacher Conference Dos and Don'ts
Finals are over and done, and grades have arrived. Now comes the dreaded time to discuss the...
Finals are over and done, and grades have arrived. Now comes the dreaded time to discuss the...

School Lunches ... Hot or Cold?
First there were four, now there are six, no one knows how many more there may be in the future....
First there were four, now there are six, no one knows how many more there may be in the future....