Forestburg School
Rating
Not Available
Not Available

No Reviews Yet
Find Old Friends From Forestburg School
Use the form below to search for alumni from Forestburg School.
School Description
School Summary and Highlights
- Enrolls 204 school students from grades PK-12
- Ranks 232nd out of 1,325 high schools in TX.
- 2010 Overall School AYP Met Status: Yes
Additional Contact Information
- Mailing Address: P O Box 415, Forestburg, TX 76239
- Principal or Admin: Mr Dustin Evans
- Fax: (940) 964-2531
- Website: www2.esc9
School Operational Details
- Title I EligibleAll students of this school are eligible for participation in authorized programs.
School District Details
- Forestburg Independent School District (ISD)
- Per-Pupil Spending: $9,611
- Graduation Rate: 80.0%
- Students Per Teacher: 11.5
- Enrolled Students: 204
Faculty Details and Student Enrollment
Students and Faculty
- Total Students Enrolled: 204
- Total Full Time "Equivalent" Teachers: 17.7
- Average Student-To-Teacher Ratio: 11.5
Students Gender Breakdown
- Males: 92 (45.1%)
- Females: 112 (54.9%)
Free Lunch Student Eligibility Breakdown
- Eligible for Reduced Lunch: 28 (13.7%)
- Eligible for Free Lunch: 70 (34.3%)
- Eligible for Either Reduced or Free Lunch: 98 (48.0%)
Student Enrollment Distribution by Race / Ethnicity

| Number | Percent | |
|---|---|---|
| American Indian | 2 | 1.0% |
| Black | 3 | 1.5% |
| Asian | 1 | 0.5% |
| Hispanic | 26 | 12.7% |
| White | 172 | 84.3% |
Number of Students Per Grade
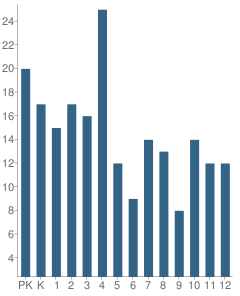
| Number | Percent | |
|---|---|---|
| Pre-Kindergarten | 20 | 9.8% |
| Kindergarten | 17 | 8.3% |
| 1st Grade | 15 | 7.4% |
| 2nd Grade | 17 | 8.3% |
| 3rd Grade | 16 | 7.8% |
| 4th Grade | 25 | 12.3% |
| 5th Grade | 12 | 5.9% |
| 6th Grade | 9 | 4.4% |
| 7th Grade | 14 | 6.9% |
| 8th Grade | 13 | 6.4% |
| 9th Grade | 8 | 3.9% |
| 10th Grade | 14 | 6.9% |
| 11th Grade | 12 | 5.9% |
| 12th Grade | 12 | 5.9% |
Breakdown of College Ready Graduates (2009)
Percent Ready For College in Reading
School:
67.0%
District:
67.0%
State:
62.0%
Percent Ready For College in Math
School:
78.0%
State:
60.0%
Graduation & Dropout Rates (2009)
Graduation Rate
School:
100.0%
District:
100.0%
State:
80.6%
Faculty Salary (2010)
School Administration Average Base Salary
School:
$58,900
District:
$58,900
State:
$70,209
Teacher Average Base Salary
School:
$38,999
District:
$38,999
State:
$48,263
Beginning Teacher Average Base Salary
School:
$31,147
District:
$31,147
State:
$41,165
Teacher With 1-5 Years Experience Average Base Salary
School:
$34,076
State:
$43,527
Teacher With 6-10 Years Experience Average Base Salary
School:
$42,777
State:
$46,149
Teacher With 11-20 Years Experience Average Base Salary
School:
$47,597
State:
$50,153
Teacher With Greater Than 20 Years Experience Average Base Salary
School:
$48,748
State:
$58,427
Faculty Breakdown (2010)
Average Teacher Experience
School:
7.2
District:
7.2
State:
11.3
Percent of Teachers With 1-5 Years Experience
School:
33.2%
District:
33.2%
State:
31.0%
Percent of Teachers With 6-10 Years Experience
School:
10.7%
District:
10.7%
State:
20.3%
Percent of Teachers With 11-20 Years Experience
School:
28.2%
District:
28.2%
State:
24.4%
Percent of Teachers With Greater Than 20 Years Experience
School:
5.6%
District:
5.6%
State:
18.3%
Source: TX Department of Education, Source: NCES 2009-2010
School Ratings and Reviews
Be The First To Review Forestburg School!
School Map and Similar Schools Nearby
Click to Activate Map of Nearby School Campuses
Private
Public
This School
Similar Schools Nearby
| Saint Jo High School 7-12 | 130 Students | 11.4 miles away |  5 out of 5 | |
| Muenster High School 7-12 | 233 Students | 13.7 miles away | 5 out of 5 | |
| Alvord High School 9-12 | 226 Students | 14.7 miles away | 5 out of 5 | |
| Slidell Junior / High School PK-12 | 243 Students | 15.4 miles away | Not Yet Rated | |
| Era School PK-12 | 440 Students | 15.9 miles away | Not Yet Rated | |
| Bowie High School 9-12 | 433 Students | 16.0 miles away | Not Yet Rated | |
| Bowie Junior High School 6-8 | 319 Students | 16.2 miles away | Not Yet Rated | |
| Lindsay High School 7-12 | 252 Students | 20.6 miles away | Not Yet Rated | |
| Nocona High School 9-12 | 227 Students | 20.7 miles away | Not Yet Rated | |
| Decatur High School 9-12 | 859 Students | 21.8 miles away |  4.5 out of 5 | |
Compare This School To Nearby Schools ->
School Community Forum

Join a discussion about Forestburg School and talk to others in the community including students, parents, teachers, and administrators.
Popular Discussion Topics
- Admissions and Registration Questions (e.g. Dress Code and Discipline Policy)
- School Calendar and Upcoming Events (e.g. Graduation)
- After School Programs, Extracurricular Activities, and Athletics (e.g. Football)
- News and Announcements (e.g. Yearbook and Class Supply List Details)
- Graduate and Alumni Events (e.g. Organizing Class Reunions)
Navigation
Can't Find What You Are Looking For?
Nearby Cities
Sponsored Links
K-12 Articles

Helping Your Child Leave the Nest
It’s all come down to this: Eighteen years of good times and bad, and now your baby bird is ready...
It’s all come down to this: Eighteen years of good times and bad, and now your baby bird is ready...

Middle School Homework and Study Habits
The report cards came home and you’re disappointed with your child’s scores. You know he has the...
The report cards came home and you’re disappointed with your child’s scores. You know he has the...

Helping Your Learning Disabled Child
Thousands of children in America struggle to learn on a daily basis. Many of them have invisible...
Thousands of children in America struggle to learn on a daily basis. Many of them have invisible...