Prairie Vista Middle School
Rating
Not Available
Not Available

No Reviews Yet
Find Old Friends From Prairie Vista Middle School
Use the form below to search for alumni from Prairie Vista Middle School.
School Description
School Summary and Highlights
- Enrolls 1,028 middle school students from grades 6-8
- Ranks 1047th out of 2,050 middle schools in CA.
- 2010 Overall School AYP Met Status: No
Additional Contact Information
- Mailing Address: 13600 South Prairie Ave., Hawthorne, CA 90250
School Operational Details
- Title I EligibleAll students of this school are eligible for participation in authorized programs.
School District Details
- Hawthorne School District
- Per-Pupil Spending: $8,675
- Graduation Rate: 18.6%
- Students Per Teacher: 22.0
- Enrolled Students: 9,137
Faculty Details and Student Enrollment
Students and Faculty
- Total Students Enrolled: 1,028
- Total Full Time "Equivalent" Teachers: 43.0
- Average Student-To-Teacher Ratio: 23.9
Students Gender Breakdown
- Males: 512 (49.8%)
- Females: 516 (50.2%)
Free Lunch Student Eligibility Breakdown
- Eligible for Reduced Lunch: 139 (13.5%)
- Eligible for Free Lunch: 805 (78.3%)
- Eligible for Either Reduced or Free Lunch: 944 (91.8%)
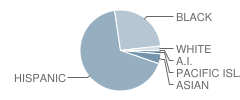
Student Enrollment Distribution by Race / Ethnicity
| Number | Percent | |
|---|---|---|
| American Indian | 2 | 0.2% |
| Black | 261 | 25.4% |
| Asian | 41 | 4.0% |
| Hispanic | 688 | 66.9% |
| White | 19 | 1.8% |
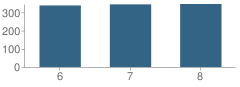
Number of Students Per Grade
| Number | Percent | |
|---|---|---|
| 6th Grade | 338 | 32.9% |
| 7th Grade | 344 | 33.5% |
| 8th Grade | 346 | 33.7% |
Teacher Education Background (2009)
Percent With Ph.D.
School:
2.0%
District:
5.3%
Percent With Master's Degree
School:
22.4%
District:
10.5%
Percent With Bachelor's Degree
School:
6.1%
District:
5.3%
Teacher Credentials & Experience (2009)
Percent of Teachers With Credentials: 97.7%
Number of Certificated Staff: 49.0
Average Number of Years of Teacher Experience: 9.6
Average Age
School:
41.3
District:
52.2
Source: CA Department of Education, Source: NCES 2009-2010
School Ratings and Reviews
Be The First To Review Prairie Vista Middle School!
School Map and Similar Schools Nearby
Click to Activate Map of Nearby School Campuses
Private
Public
This School
Similar Schools Nearby
| Bud Carson Middle School 6-8 | 843 Students | 0.6 miles away | Not Yet Rated | |
| Hawthorne Middle School 6-8 | 905 Students | 0.6 miles away |  4.5 out of 5 | |
| Ramona School KG-6 | 795 Students | 0.8 miles away | Not Yet Rated | |
| F. D. Roosevelt Elementary School 3-6 | 380 Students | 1.1 miles away | Not Yet Rated | |
| Will Rogers Middle School 6-8 | 1,022 Students | 1.3 miles away | Not Yet Rated | |
| Jane Addams Middle School 6-8 | 915 Students | 1.4 miles away | Not Yet Rated | |
| Richard Henry Dana Middle School 6-8 | 935 Students | 1.9 miles away |  5 out of 5 | |
| Lennox Middle School 6-8 | 1,869 Students | 2.2 miles away | Not Yet Rated | |
| Henry Clay Middle School 6-8 | 1,141 Students | 2.2 miles away | Not Yet Rated | |
| Albert F. Monroe Middle School 6-8 | 904 Students | 2.3 miles away | Not Yet Rated | |
Compare This School To Nearby Schools ->
School Community Forum

Join a discussion about Prairie Vista Middle School and talk to others in the community including students, parents, teachers, and administrators.
Popular Discussion Topics
- Admissions and Registration Questions (e.g. Dress Code and Discipline Policy)
- School Calendar and Upcoming Events (e.g. Graduation)
- After School Programs, Extracurricular Activities, and Athletics (e.g. Football)
- News and Announcements (e.g. Yearbook and Class Supply List Details)
- Graduate and Alumni Events (e.g. Organizing Class Reunions)
Navigation
Can't Find What You Are Looking For?
Rankings
Nearby Cities
Sponsored Links
K-12 Articles

Keep Morning Stress at a Minimum: Establish a Routine
Morning! It can be a time of stress. The kids are fighting over who gets to use the bathroom first,...
Morning! It can be a time of stress. The kids are fighting over who gets to use the bathroom first,...

It's the Most Wonderful Time of the Year!
For most of the country, school is starting up this week or later this month-at the beginning of...
For most of the country, school is starting up this week or later this month-at the beginning of...

Helping Young Children with Printing and Cursive Writing
Is your child experiencing difficulty printing or writing? Is he unable to print or write legibly,...
Is your child experiencing difficulty printing or writing? Is he unable to print or write legibly,...